Technicolor
CineGlass | An enterprise end-to-end asset driven workflow management system for content creators and distributors in the film production and entertainment industry.
Business Problem
Film production creators and distributors at Technicolor had no visibility across the entire feature film production workflow, from script to distribution. CineGlass minimized waste and redundancy, provided effective forecasting, resource allocation, and competitive scheduling releases.
Constraints
CineGlass had to integrate into decades-old, embedded, and mostly analog practices. It would touch almost every division throughout Technicolor.
During production, Technicolor’s entire film service division was shut down. The CineGlass project continued through the shutdown and the team size was reduced. Executive support and company-wide commitment to the project were crucial for success.
User Experience
Strategic Services
Discovery
I worked closely with the internal film production team to gather a detailed understanding of the film production workflow, the project’s underpinning technology, and intended users.
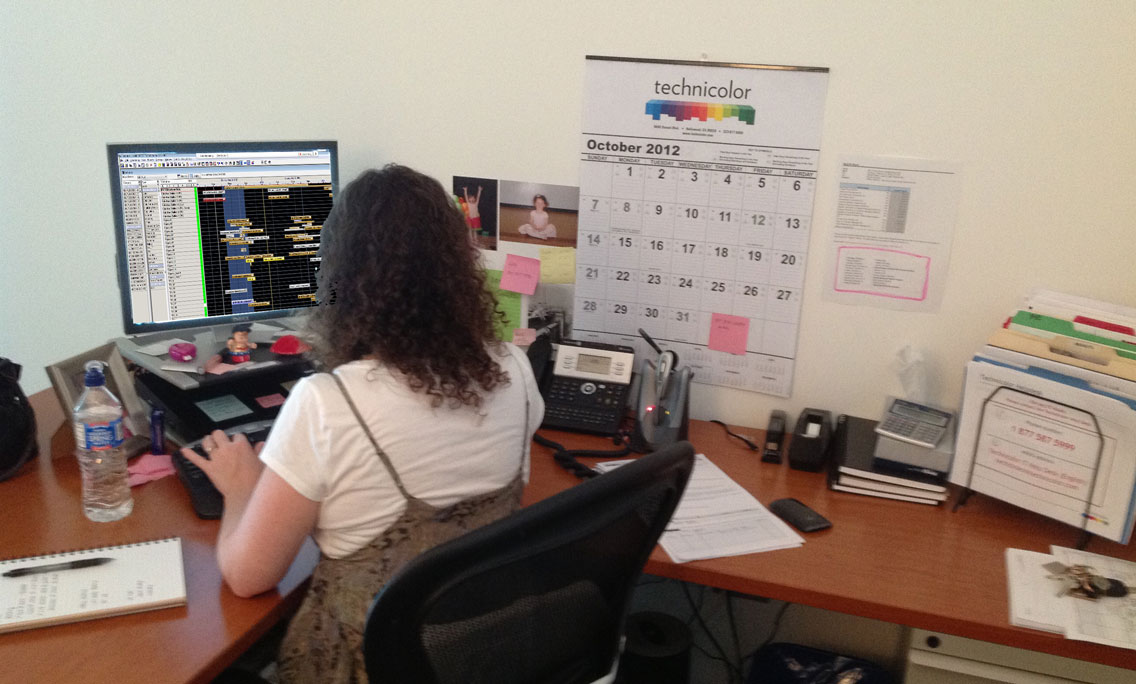
Local Production Staff Interviews
To learn firsthand about Technicolor’s departmental organization and general production workflow, I interviewed local post production staff. I became familiar with existing tools; but more importnatly I learned about the ingrained protocols and both the desire for, but resistance to change.
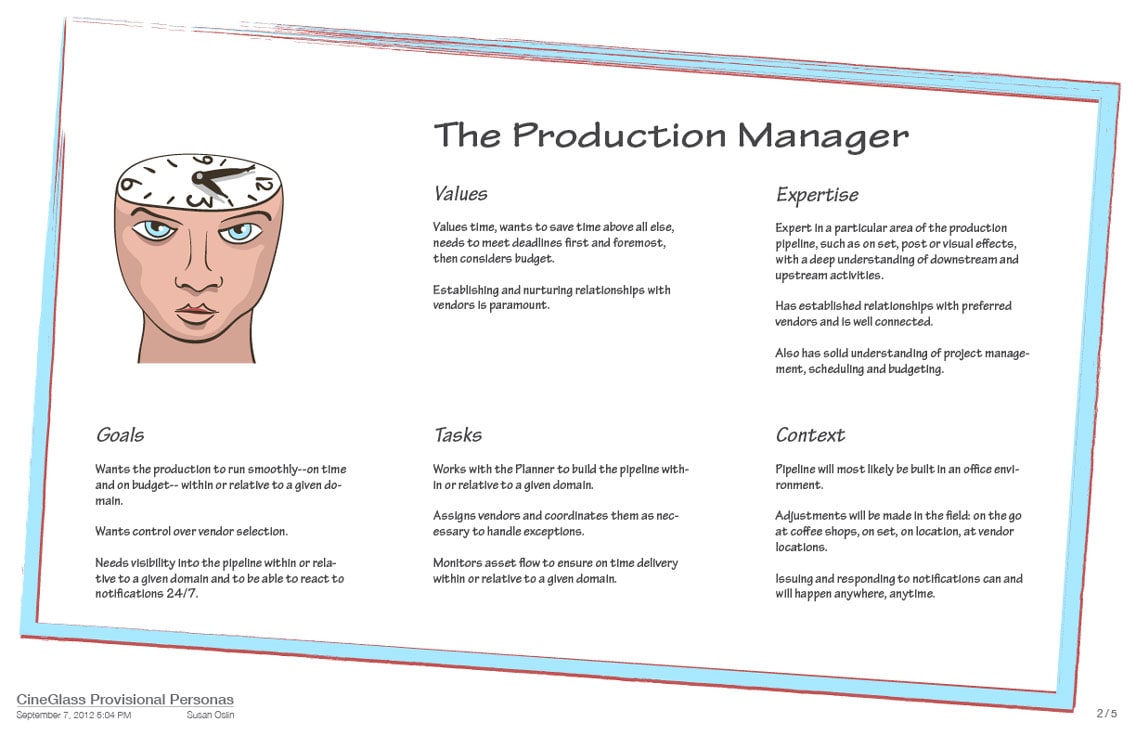
Provisional Personas
Provisional personas, based on subject matter experts, anticipated stakeholders’ behaviors, needs and goals. These were later validated and revised according to findings from ethnographic fieldwork.
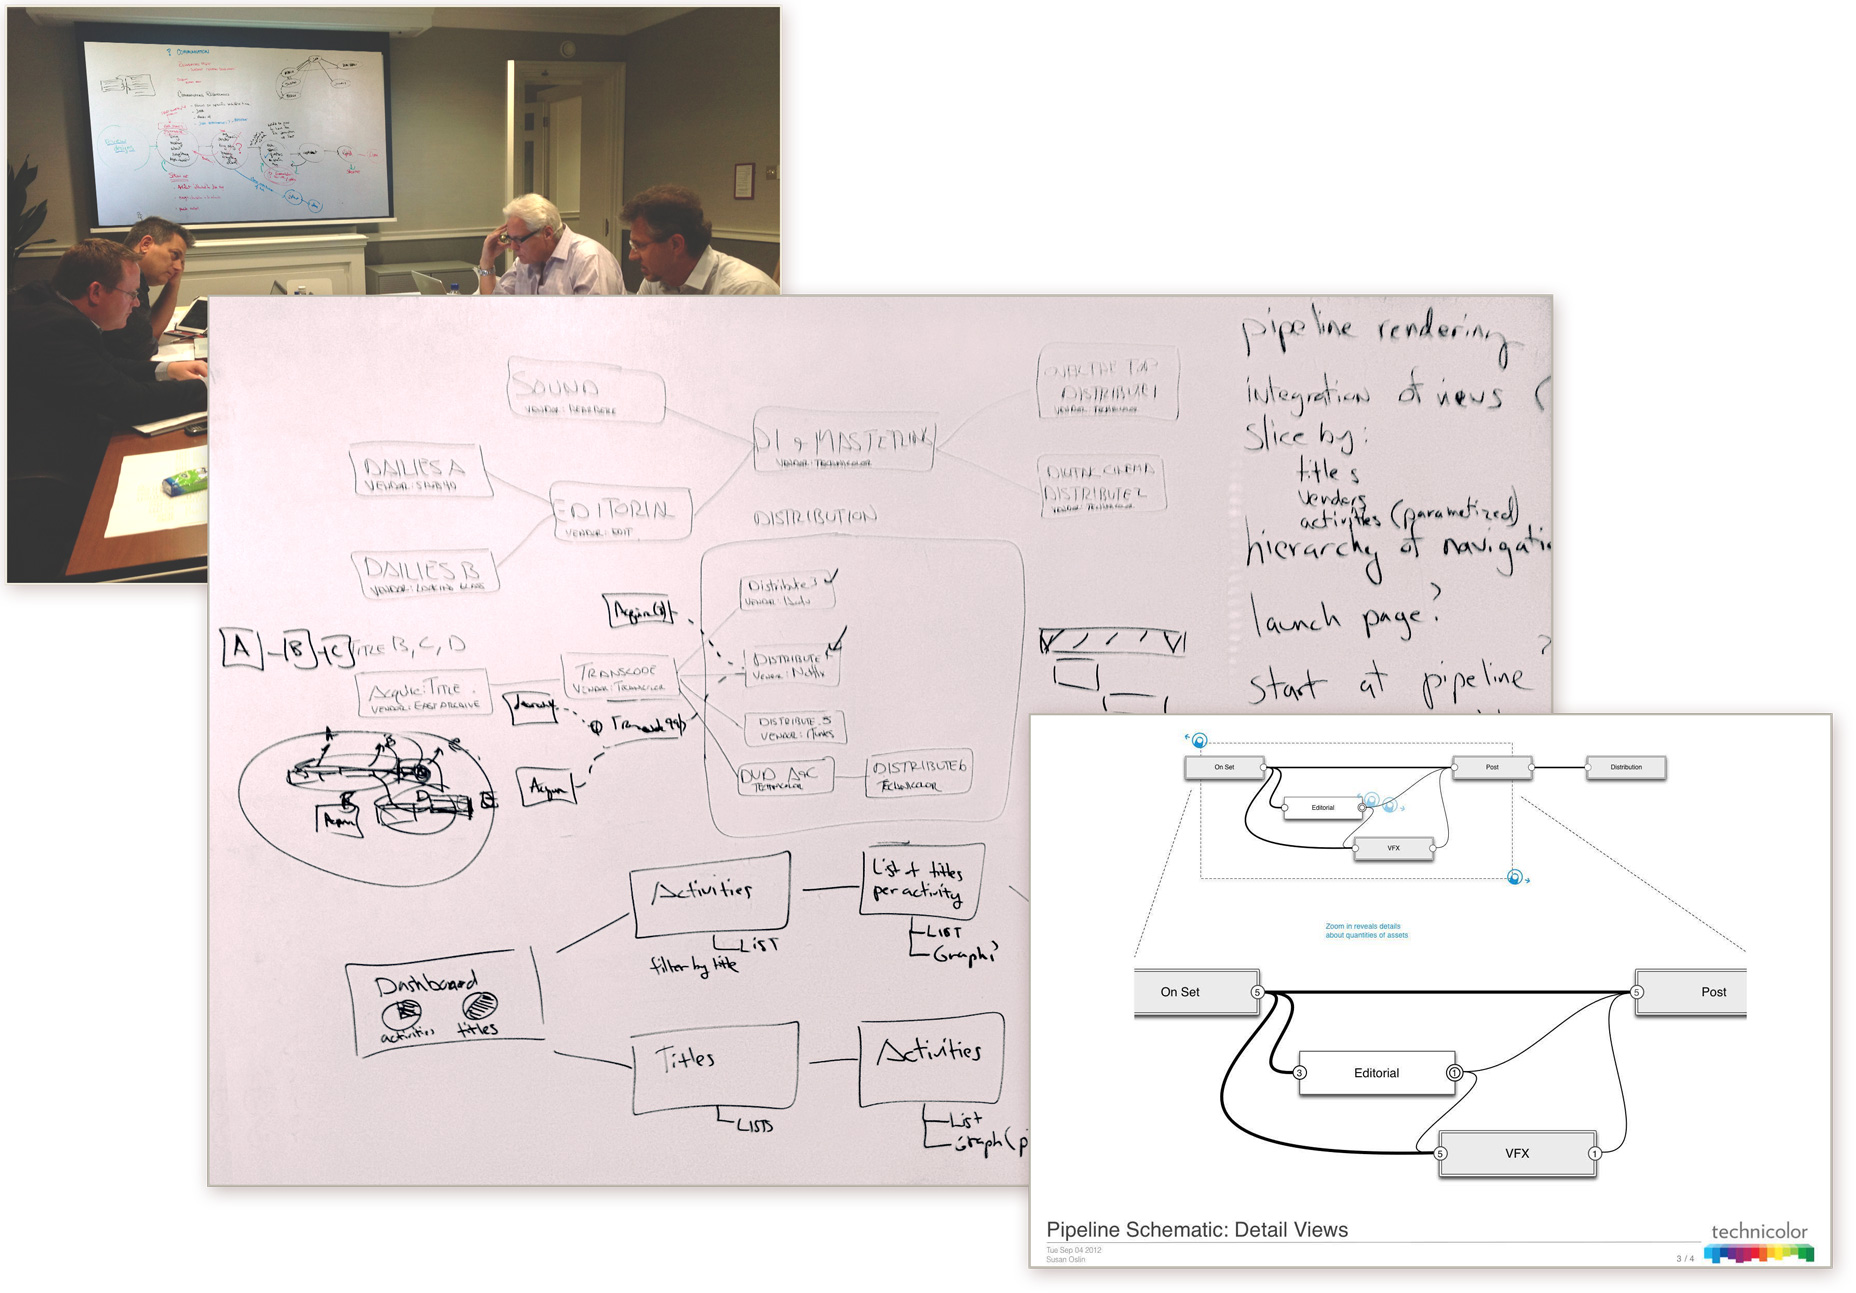
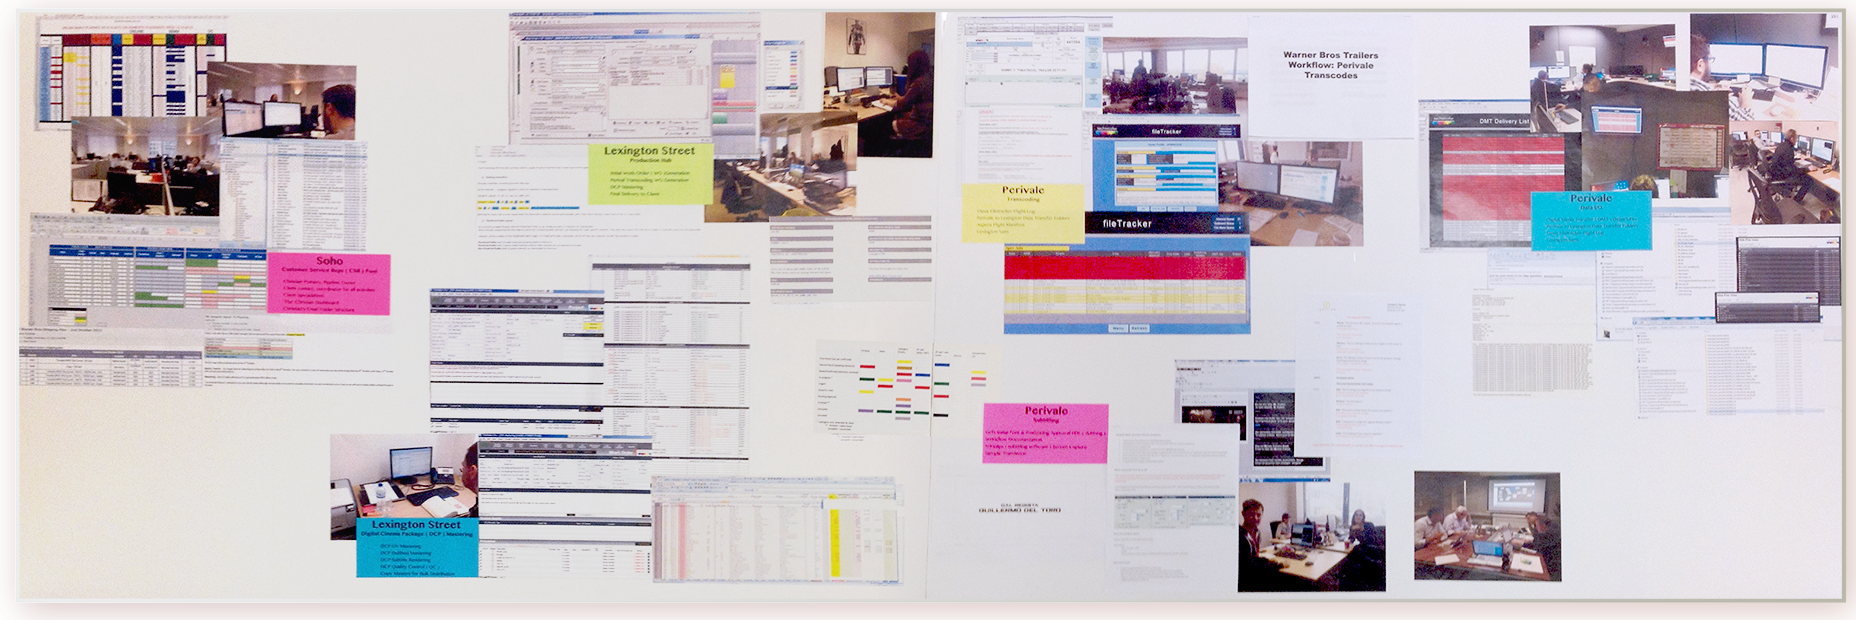
White Board Sketches
Design collaboration white boarding with the core team in order to iterate quickly on potential interface requirements and further define technical data structures.
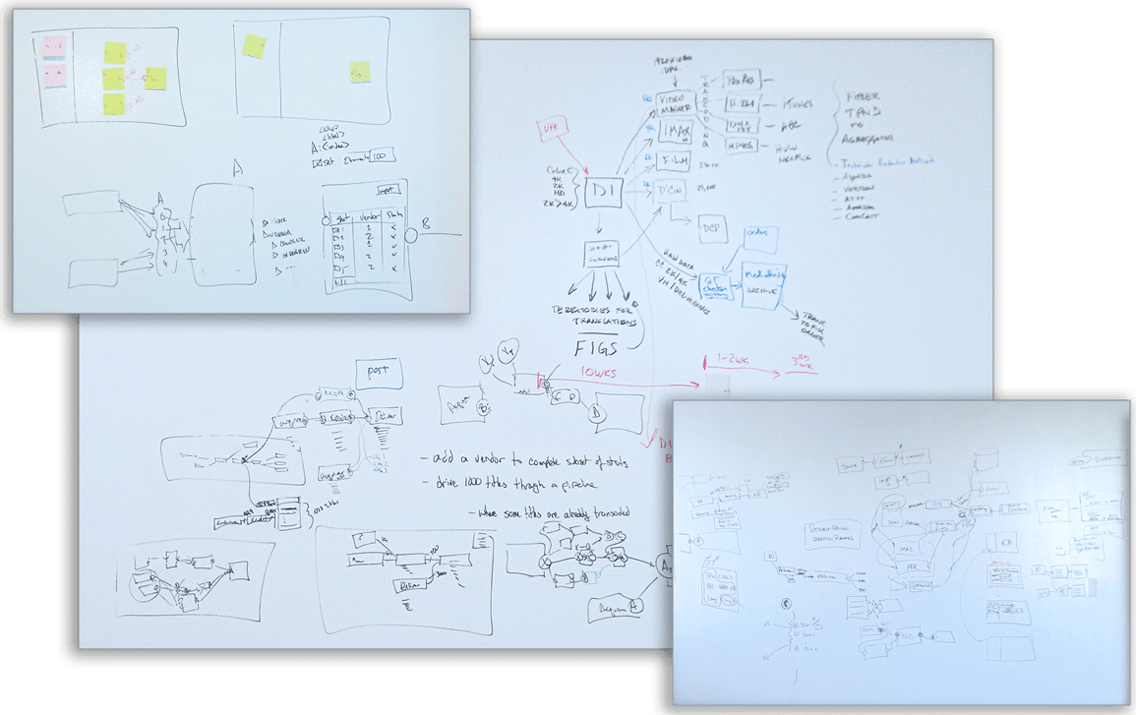
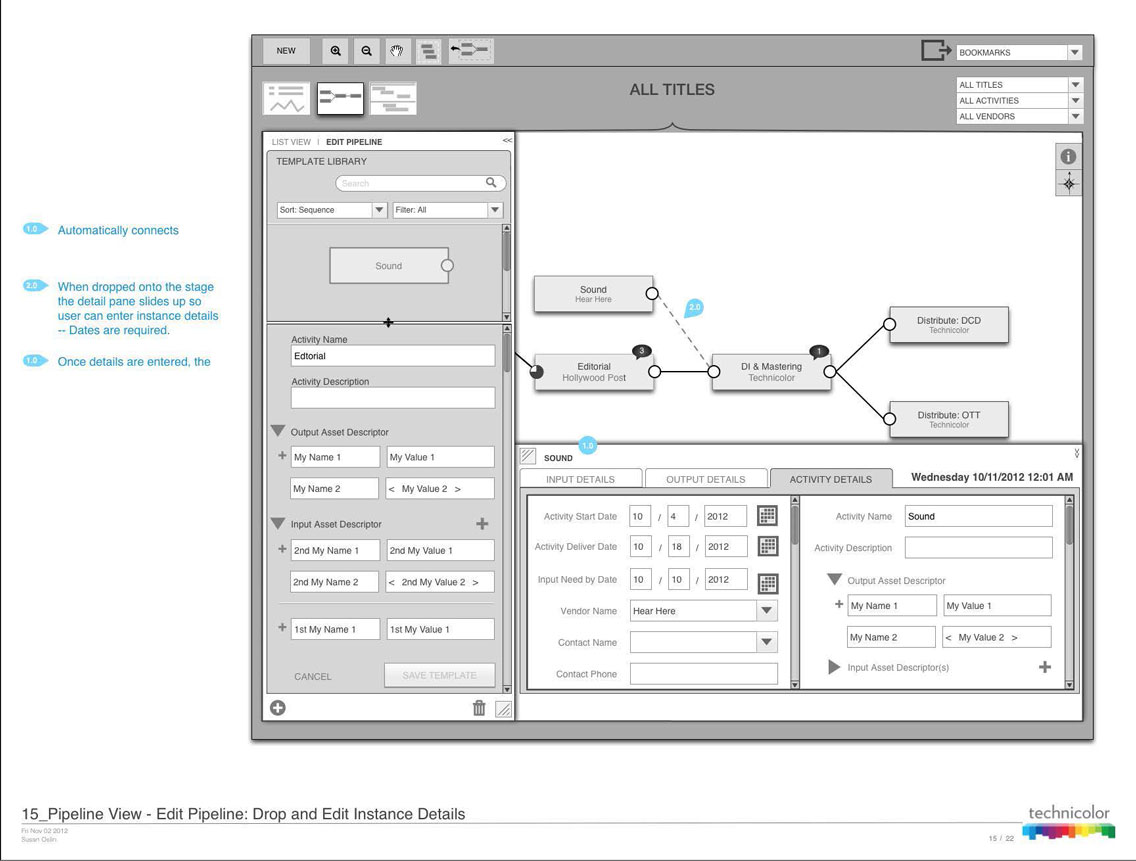
Wireframe/Sketch of the Pipeline
Preliminary wires explore possible pipeline visualizations according to developing technology. In turn, the resulting design explorations informs the further development of the technology.
Notifications System
By rapidly documenting high level discussions from the team’s explorations of detailed tracking of the assets, their states and smart systems warnings; the team could understand the required architecture to support the system even before coding.
Rapid Collaborative Ideation
Early sprints were intimate with the core team: myself, the system engineer, and the lead developer. My office was the war room. It was dynamic, alive and always open for anyone that had a new idea to test out or get feedback on. It was about the rapid iteration of ideas, sketches (lots of them), wireframes, code, and collaboration.
Strategy
UX Strategy starts with establishing alignment around the project goals and measurable success criteria. I led the development of the primary strategy with the executive and production teams.
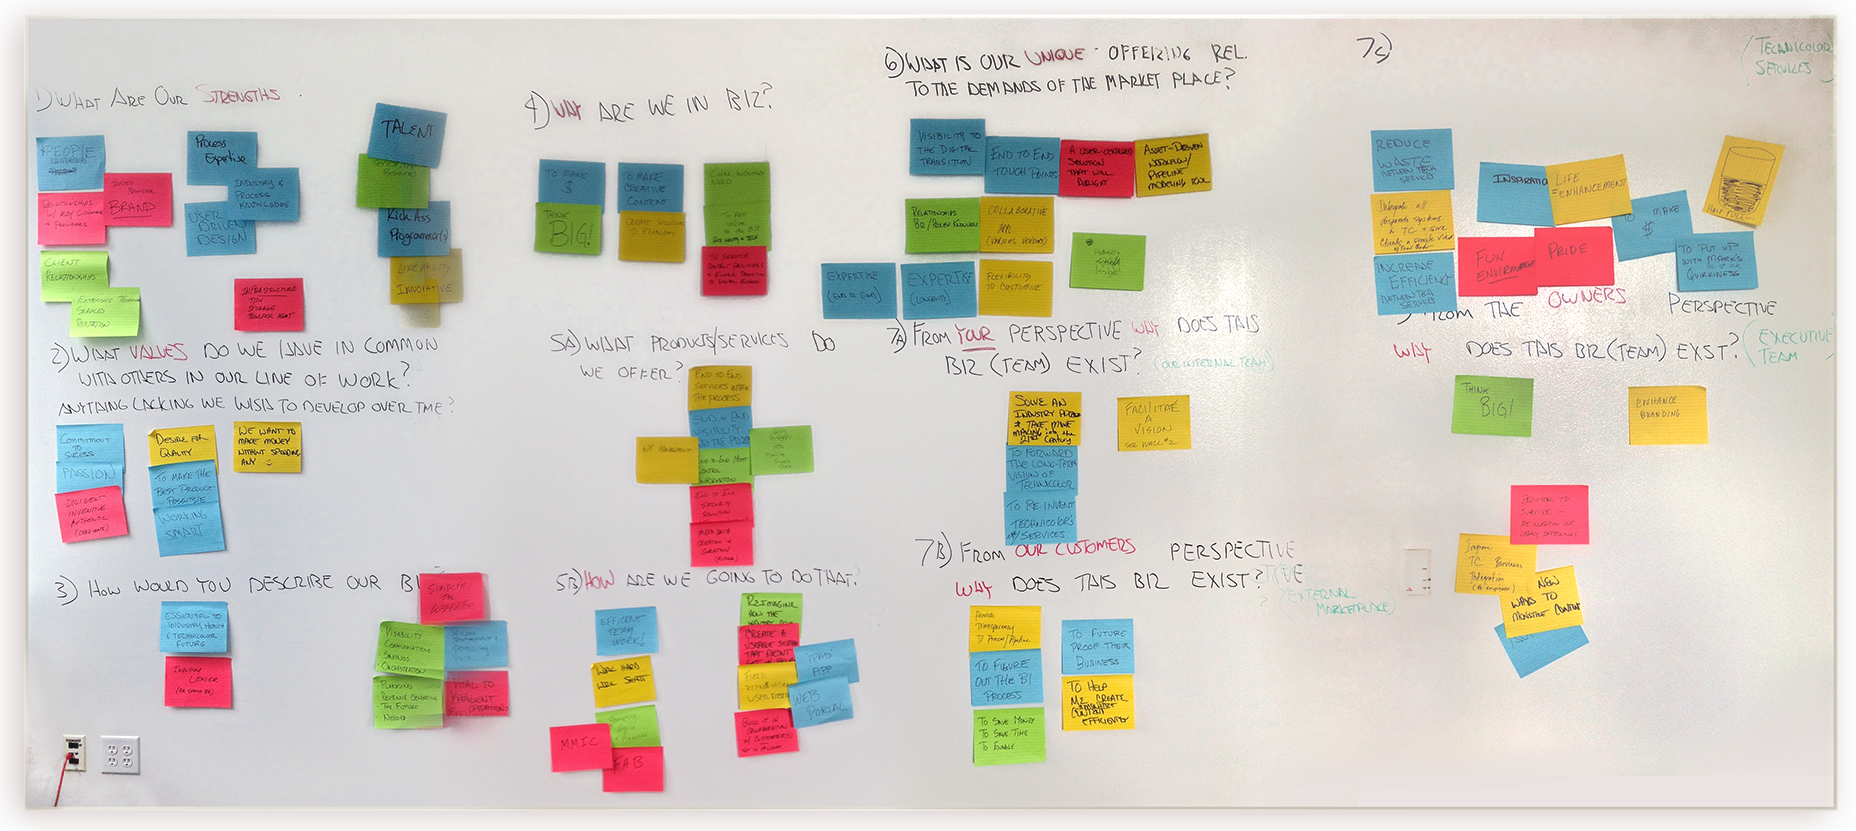
Team Mission and Values
A series of questions were provided that required deep thinking into what we were doing, why, for whom, questions about the industry, our competition, etc. We worked with sticky notes in the war room as a team to find answers and assimilate them into a set of core values, and a mission and vision statement.

Business Case Hypothesis
Lean UX starts with an idea, an assumption, a business hypothesis and then methodically iterates to either validate the idea or ‘pivot’ based on the collected user data.
Initial Interface Design
Using the business knowledge described in this section, and the assumptions we felt comfortable making about the user’s needs and goals, and the foundational understanding of the underlying technology, it was time to take the first stab(s) at the interface
Design Leadership
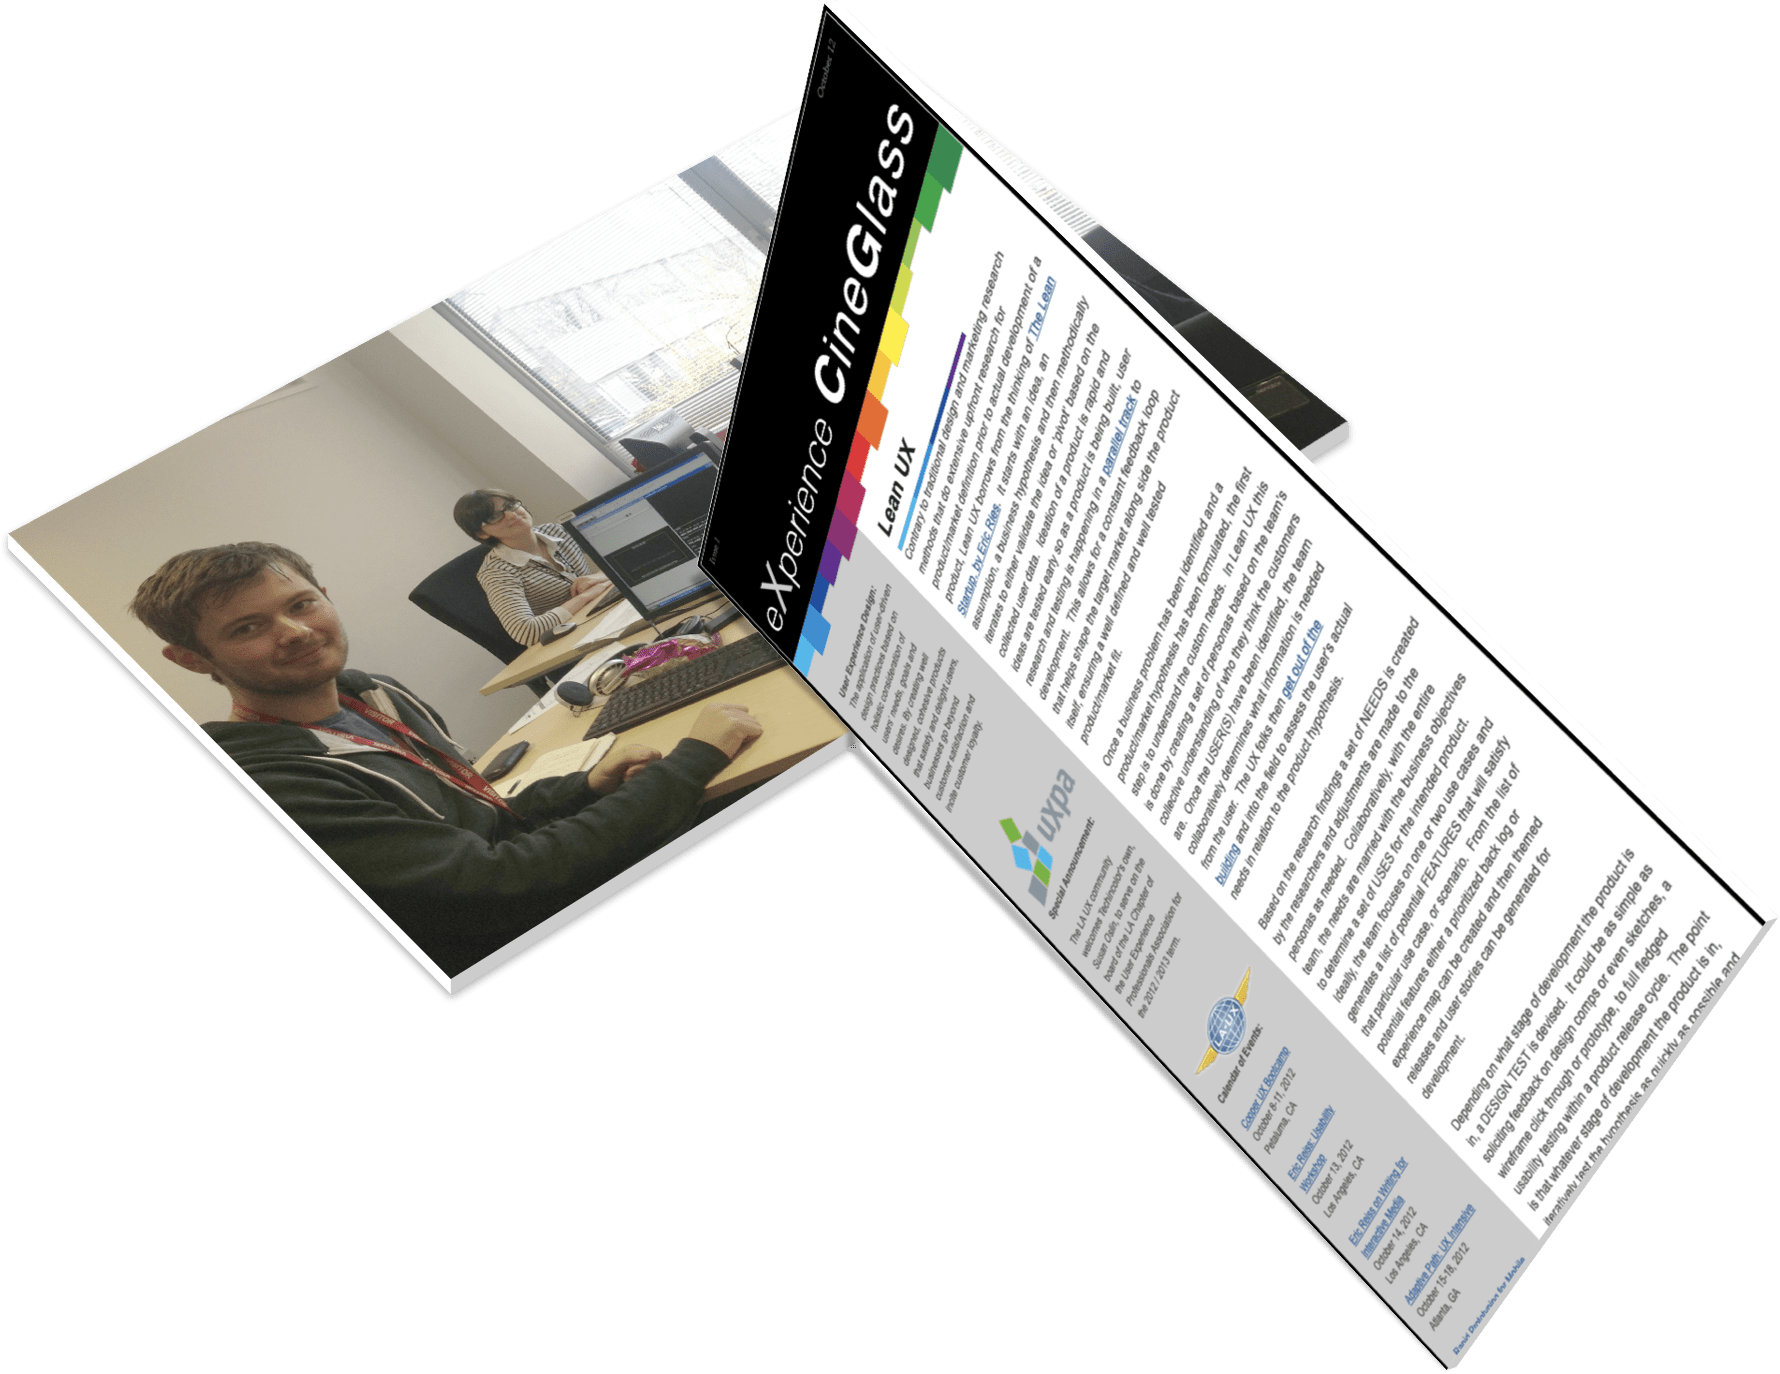
I elevated the influence of user experience design and achieved a shared product vision by leading collaborative design exercises that included the executive team. I also started the eXperience CineGlass newsletter to educate and inform stakeholders about the value of design thinking and user experience
In the early stages of design thinking, I included all members of the production team, regardless of roles, in defining a set of unified core values, along with mission and vision statements. This gave teammates a deeper sense of connection and ownership of the design.
Research
After identifying personas, assembling the hypothesis, and building the underlying architecture, I took the team into the field to assess the user’s actual needs in relation to the product hypothesis.
Data Architecture Validation
The architecture needed validating too. With real data, it became obvious that our initial thoughts about the pipeline as the primary view required rethinking.
User’s Mental Model
Our assumption that the workflow revolved around receiving and sending assets was spot on, but we learned a lot about how the users actually wanted to see the data. What we learned is that the user’s mental model expected to see something more like the arrival and departure boards at an airport.
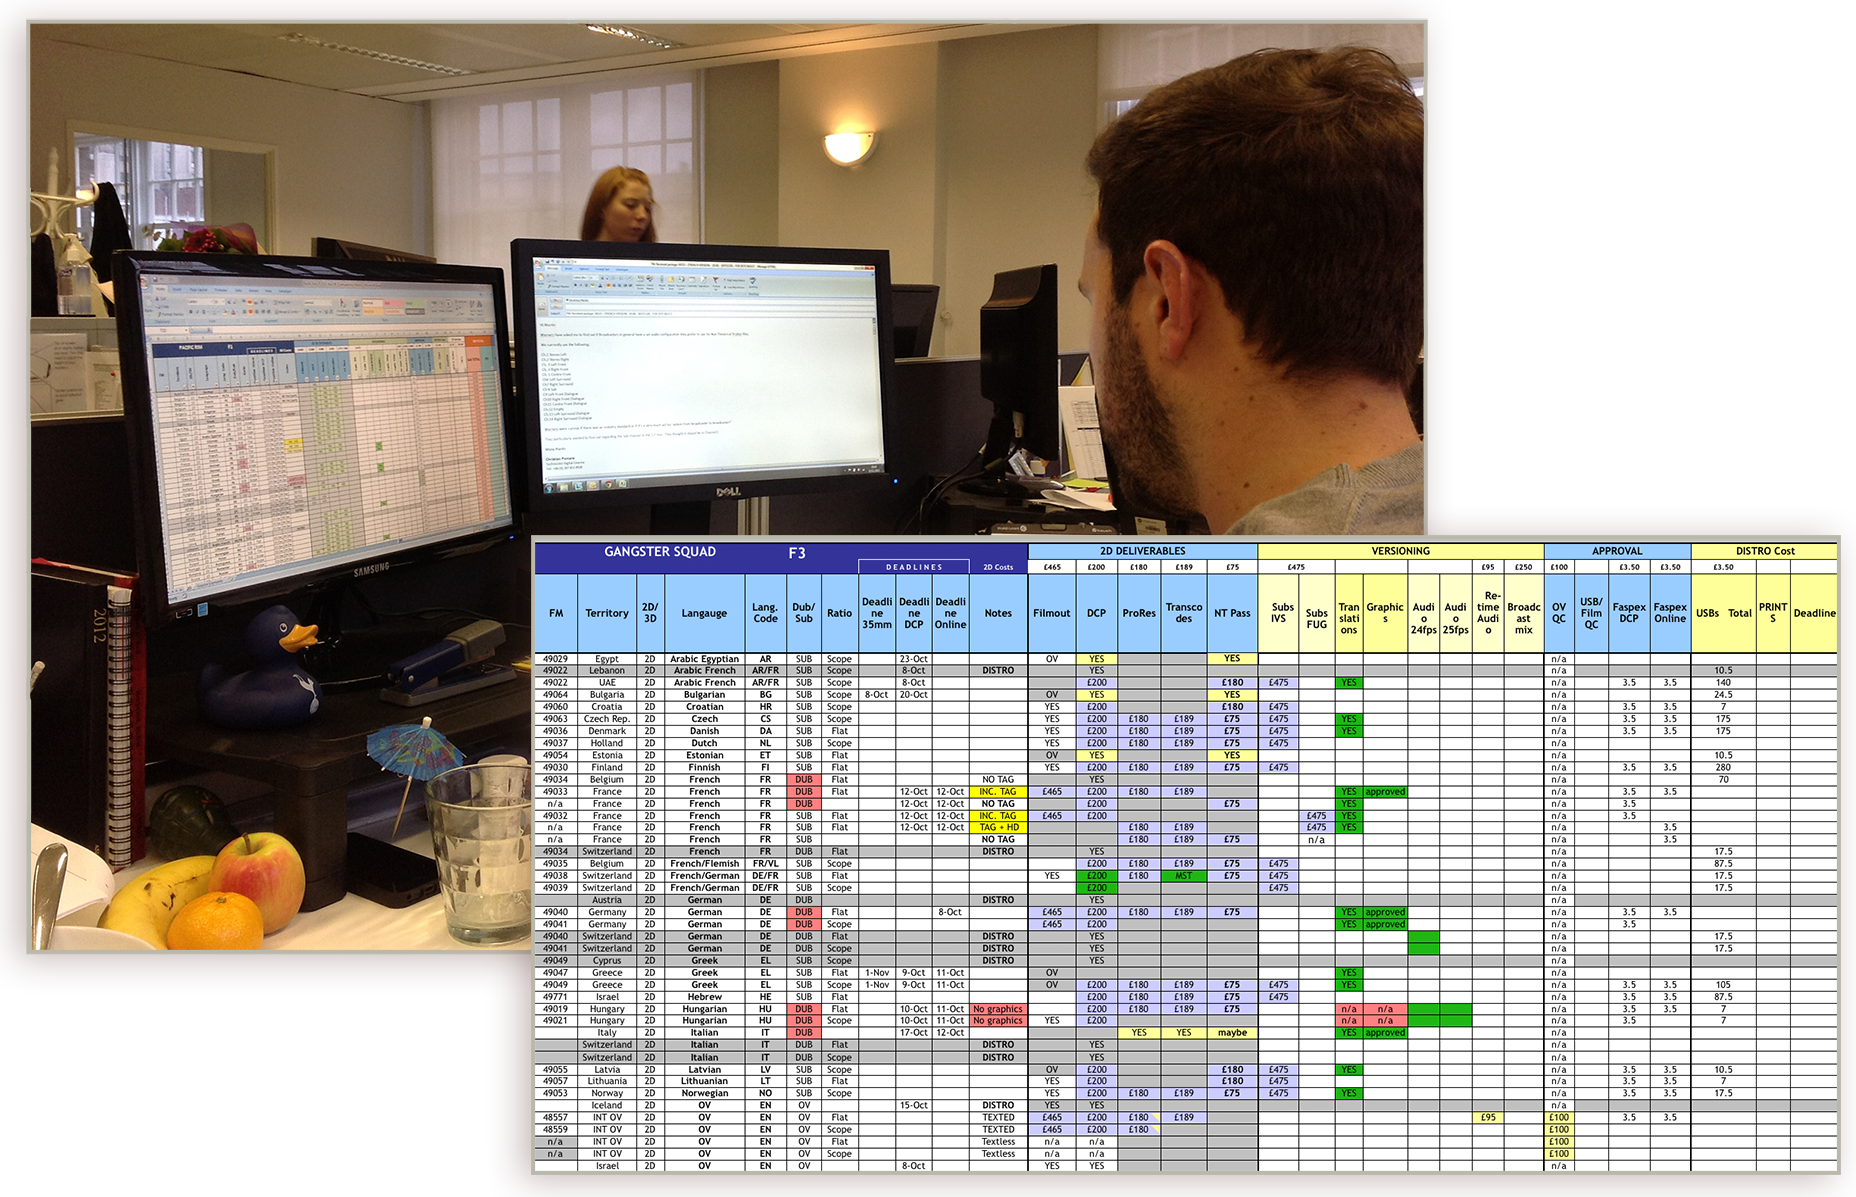
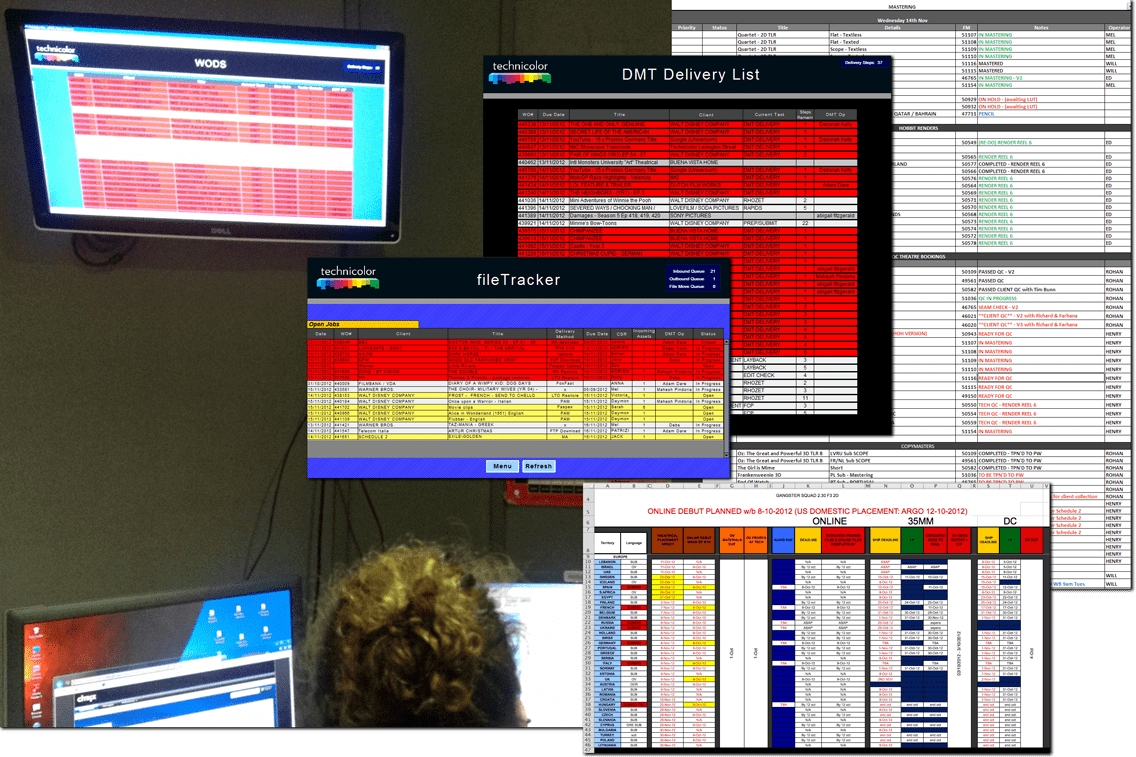
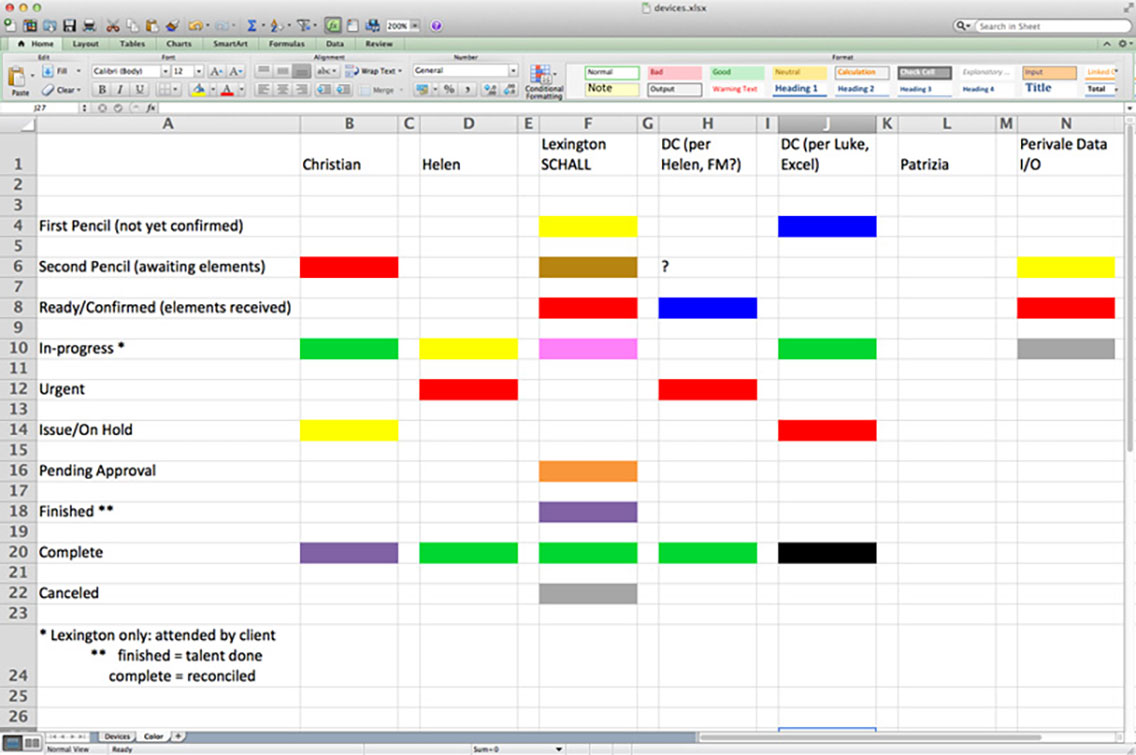
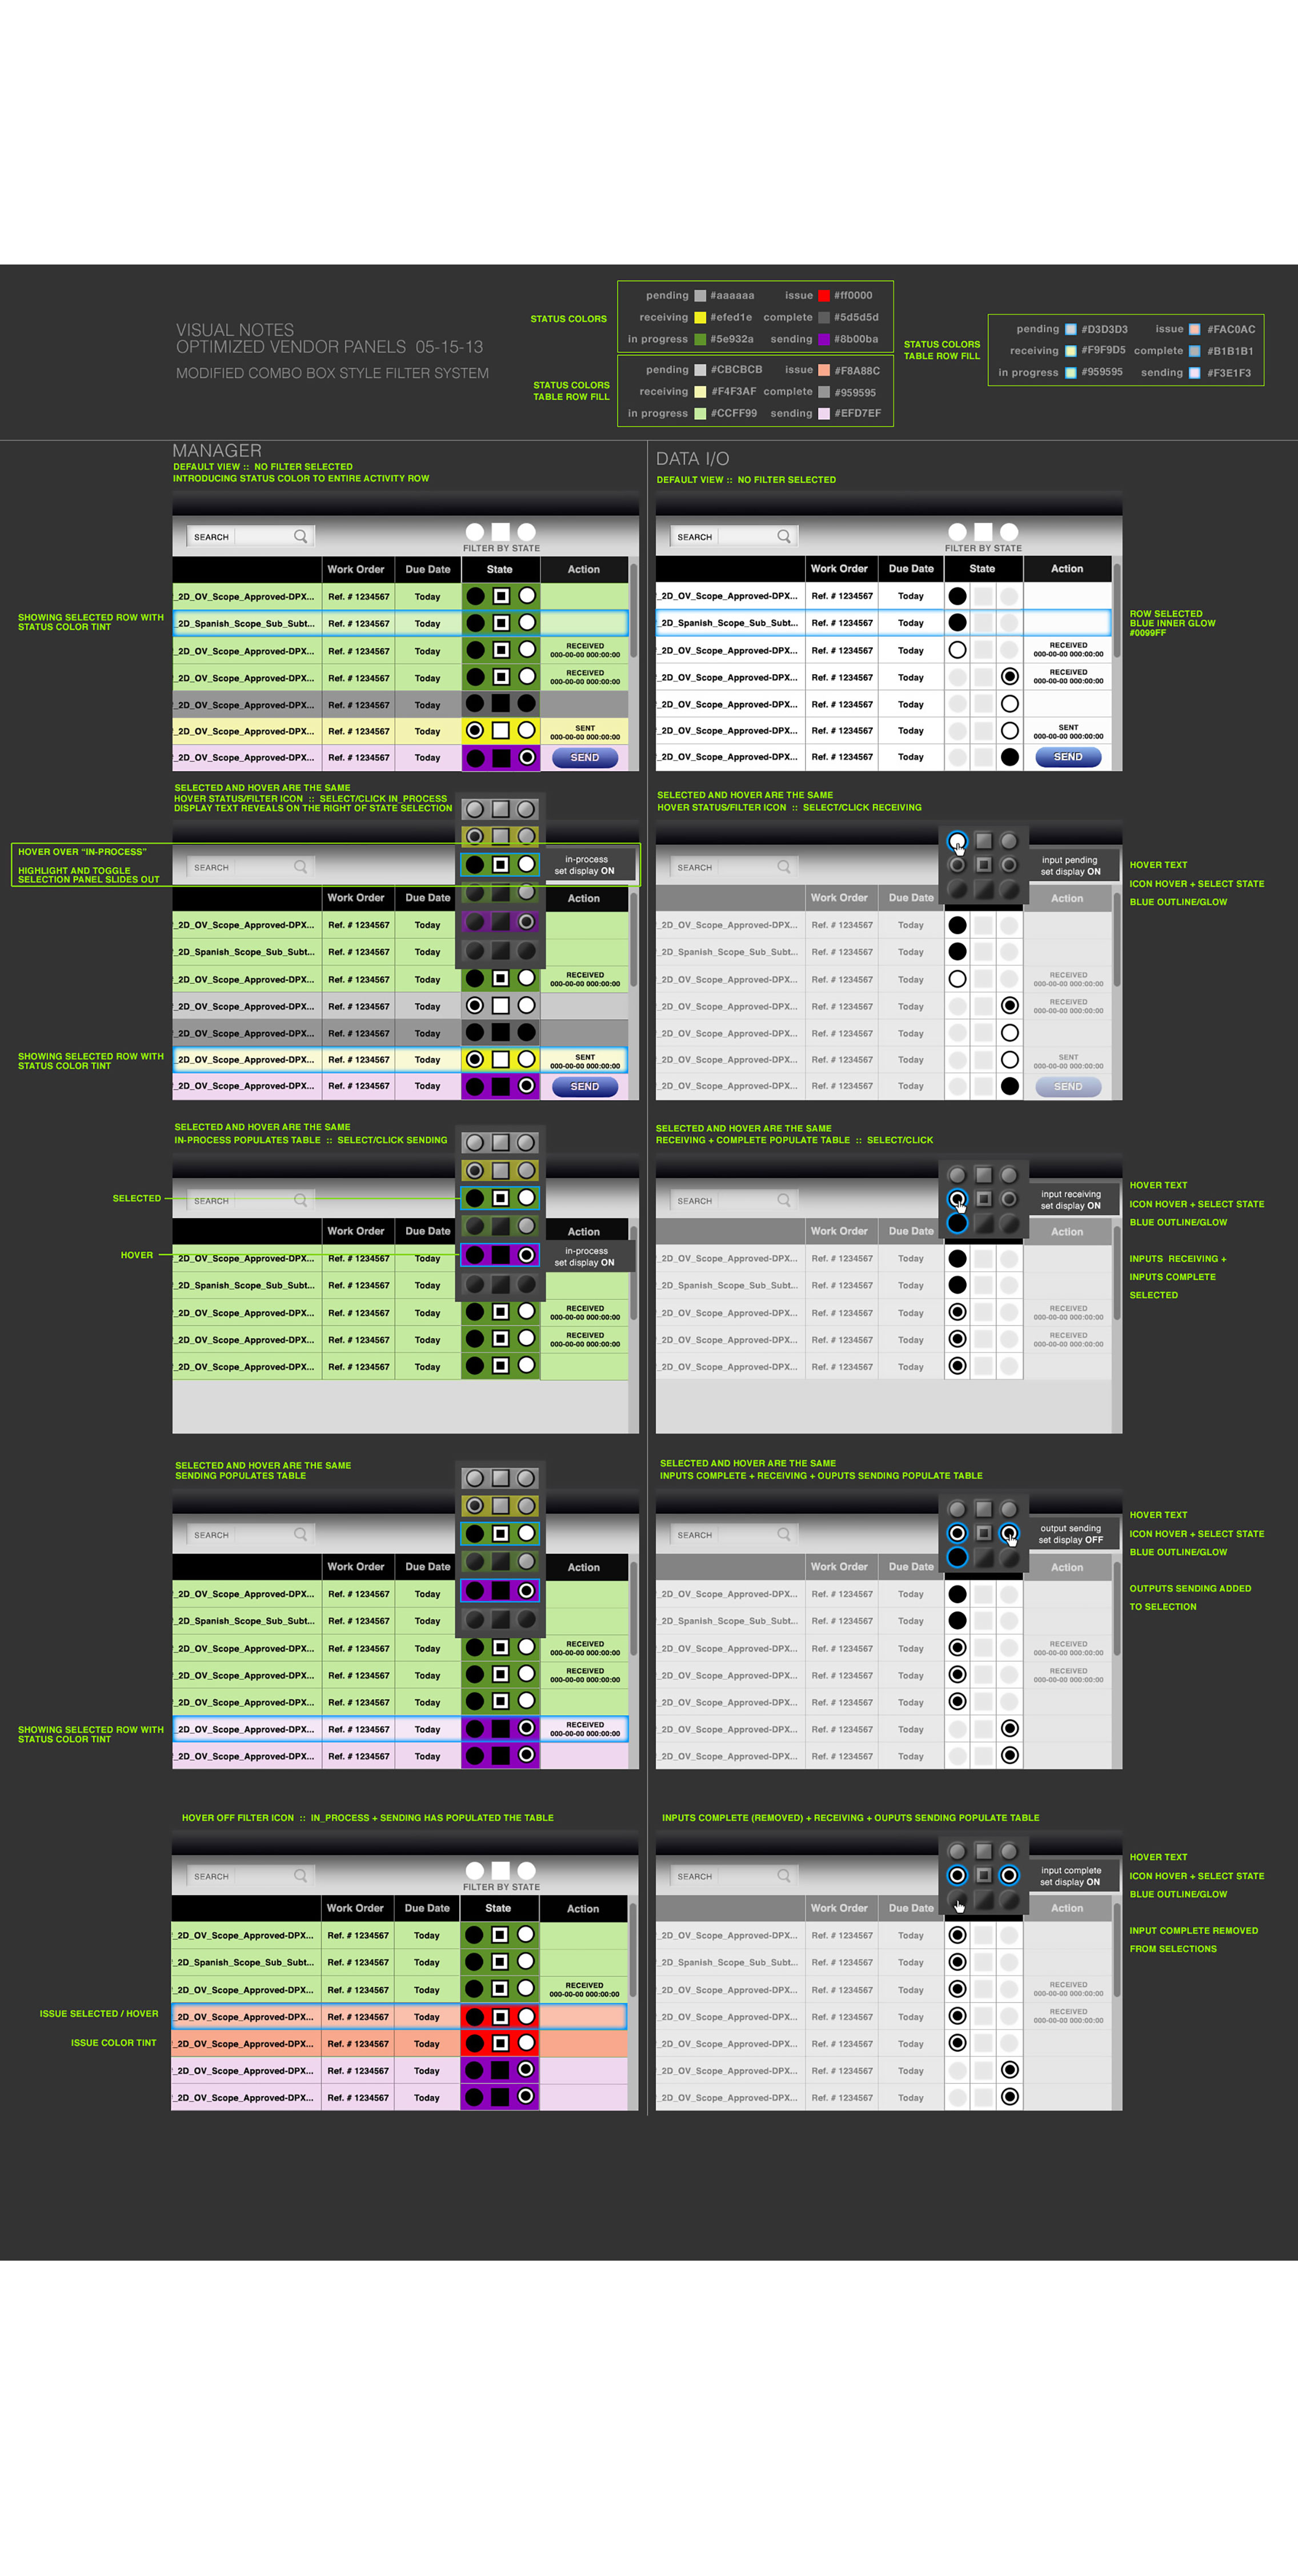
Color Study Across Exisiting Products
It was interesting to document the color uses across the systems used in the various departments. The color was all over the place, lacked standards and there was no palette that would provide uniform transition for all departments. It also emphasized the fragmentation of the existing systems and the need need for unification.
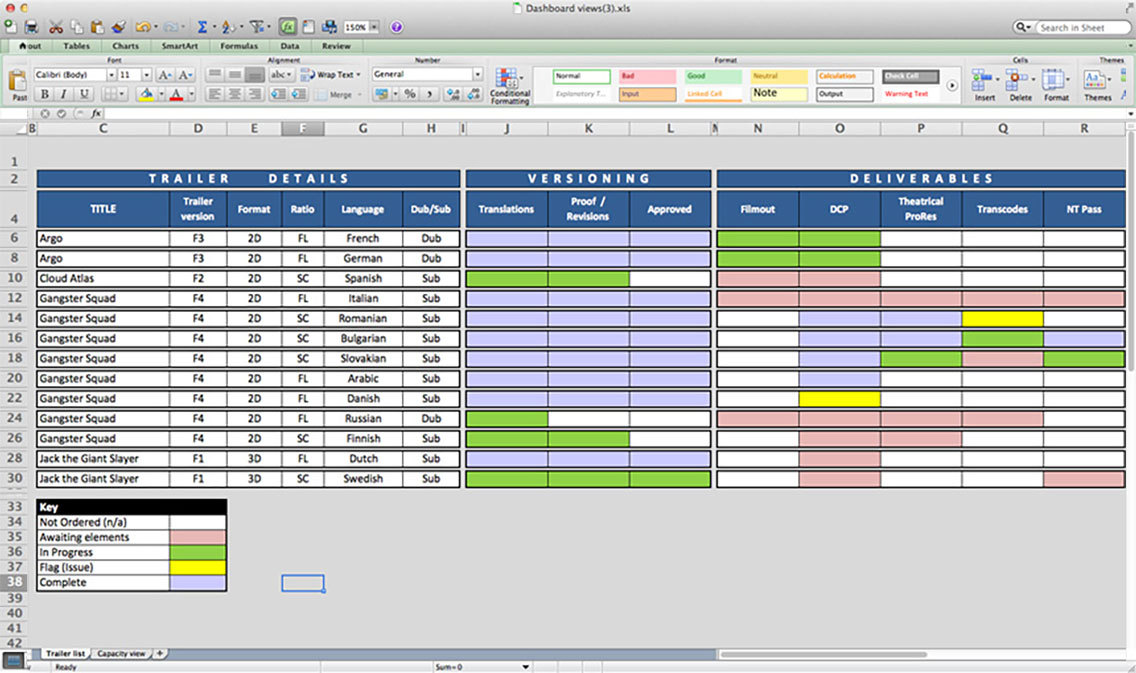
Christian’s Dashboard
We invited Christian, the producer, onto our team as an integral contrib- utor. With a good understanding of what we were intending, Christian gave us his idea about what he thought the dashboard would look like. Caution when allowing the client to design!
Contextual Studies
I used ethnographic research, user interviews, and task analysis to form a deep understanding of the trailer localization production and distribution process. I also gained an understanding of the needs, behaviors, and goals of the people making it happen. This led to my insights into the eventual dashboard solution.
Design
Based on the research findings a set of NEEDS is uncovered by the researchers and adjustments are made to the personas as needed. Collaboratively, with the entire team, the needs are married with the business objectives to determine a set of USE CASES for the intended product.
Final Personas
Many of our assumptions were correct, but based on real people, we adjusted where we our research revealed misalignment or false assumptions.

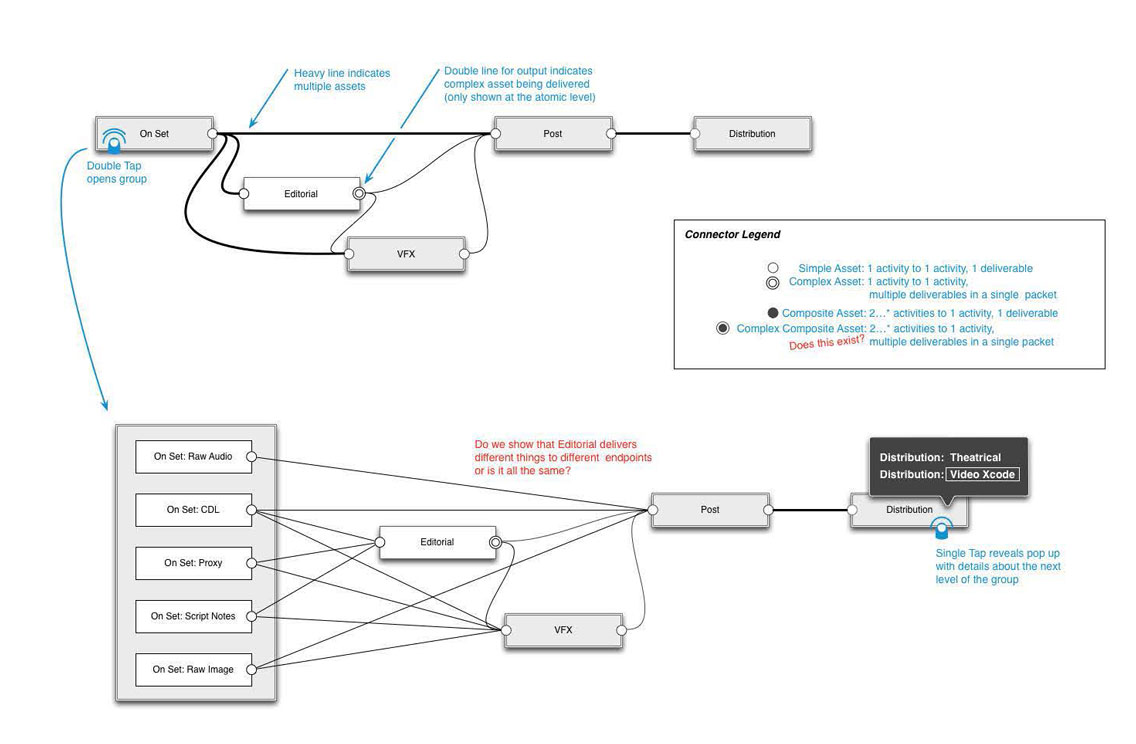
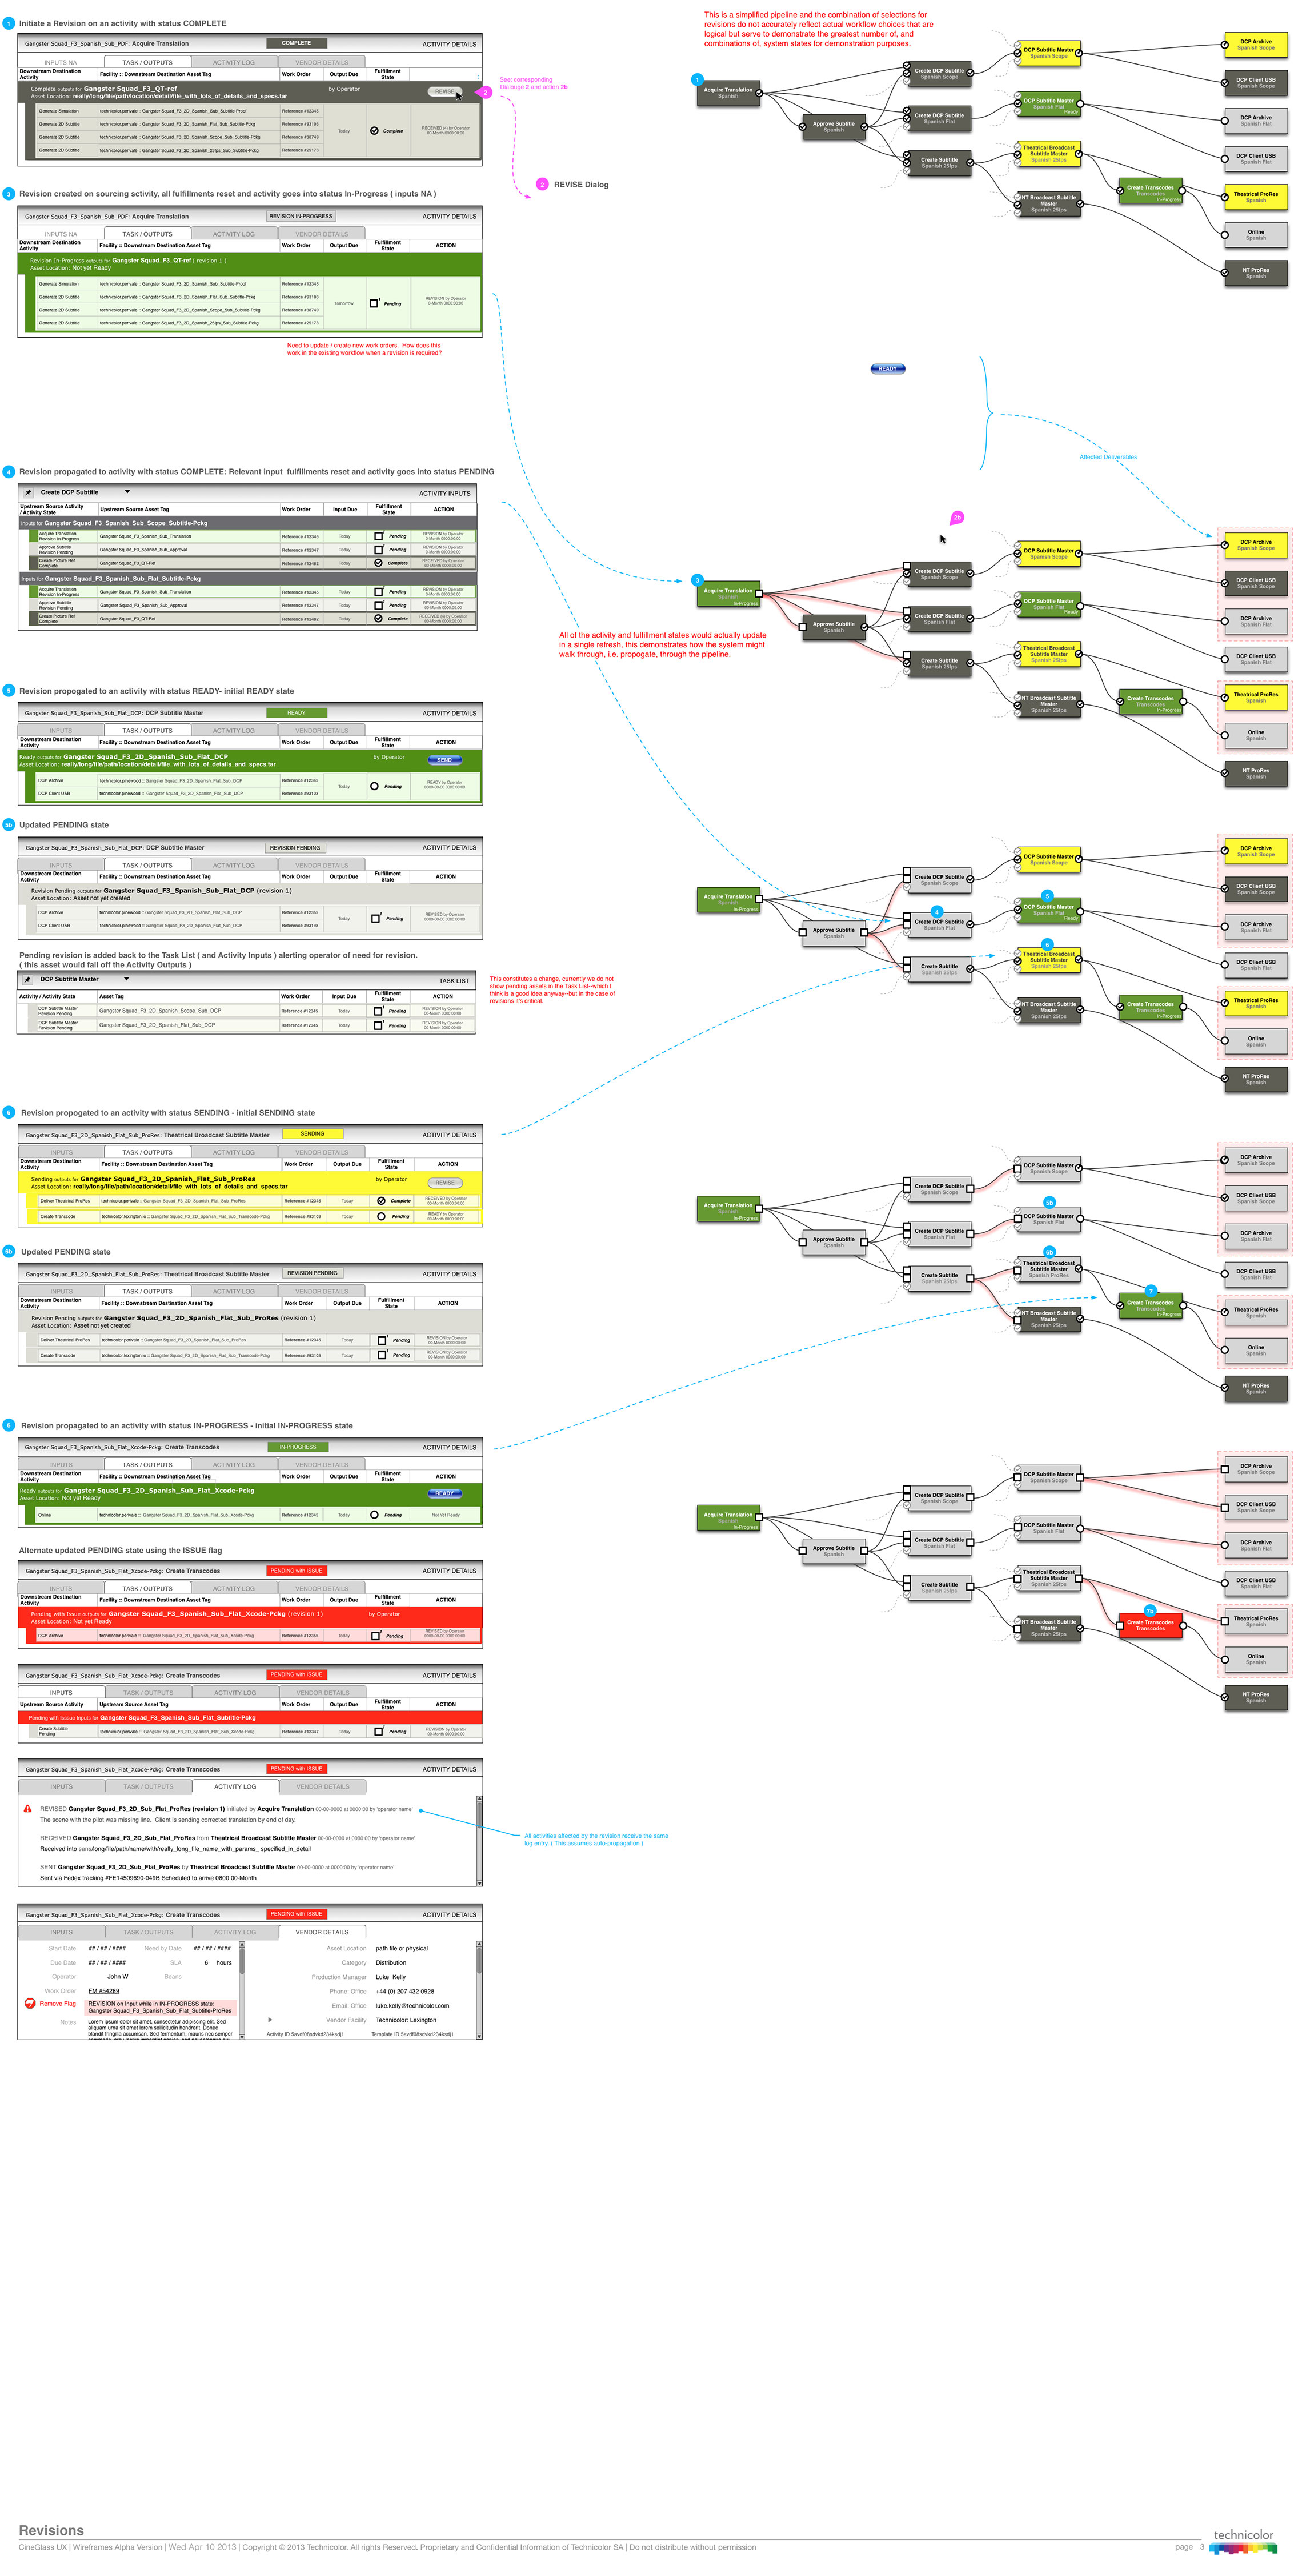
Interaction Flow Diagram
By creating an existing workflow interactions diagram, I documented where asset dependencies existed and between which stakeholders and which existing systems, throughout the production stages. This allowed the team to understand where and how CineGlass should be implemented to optimize the workflow.
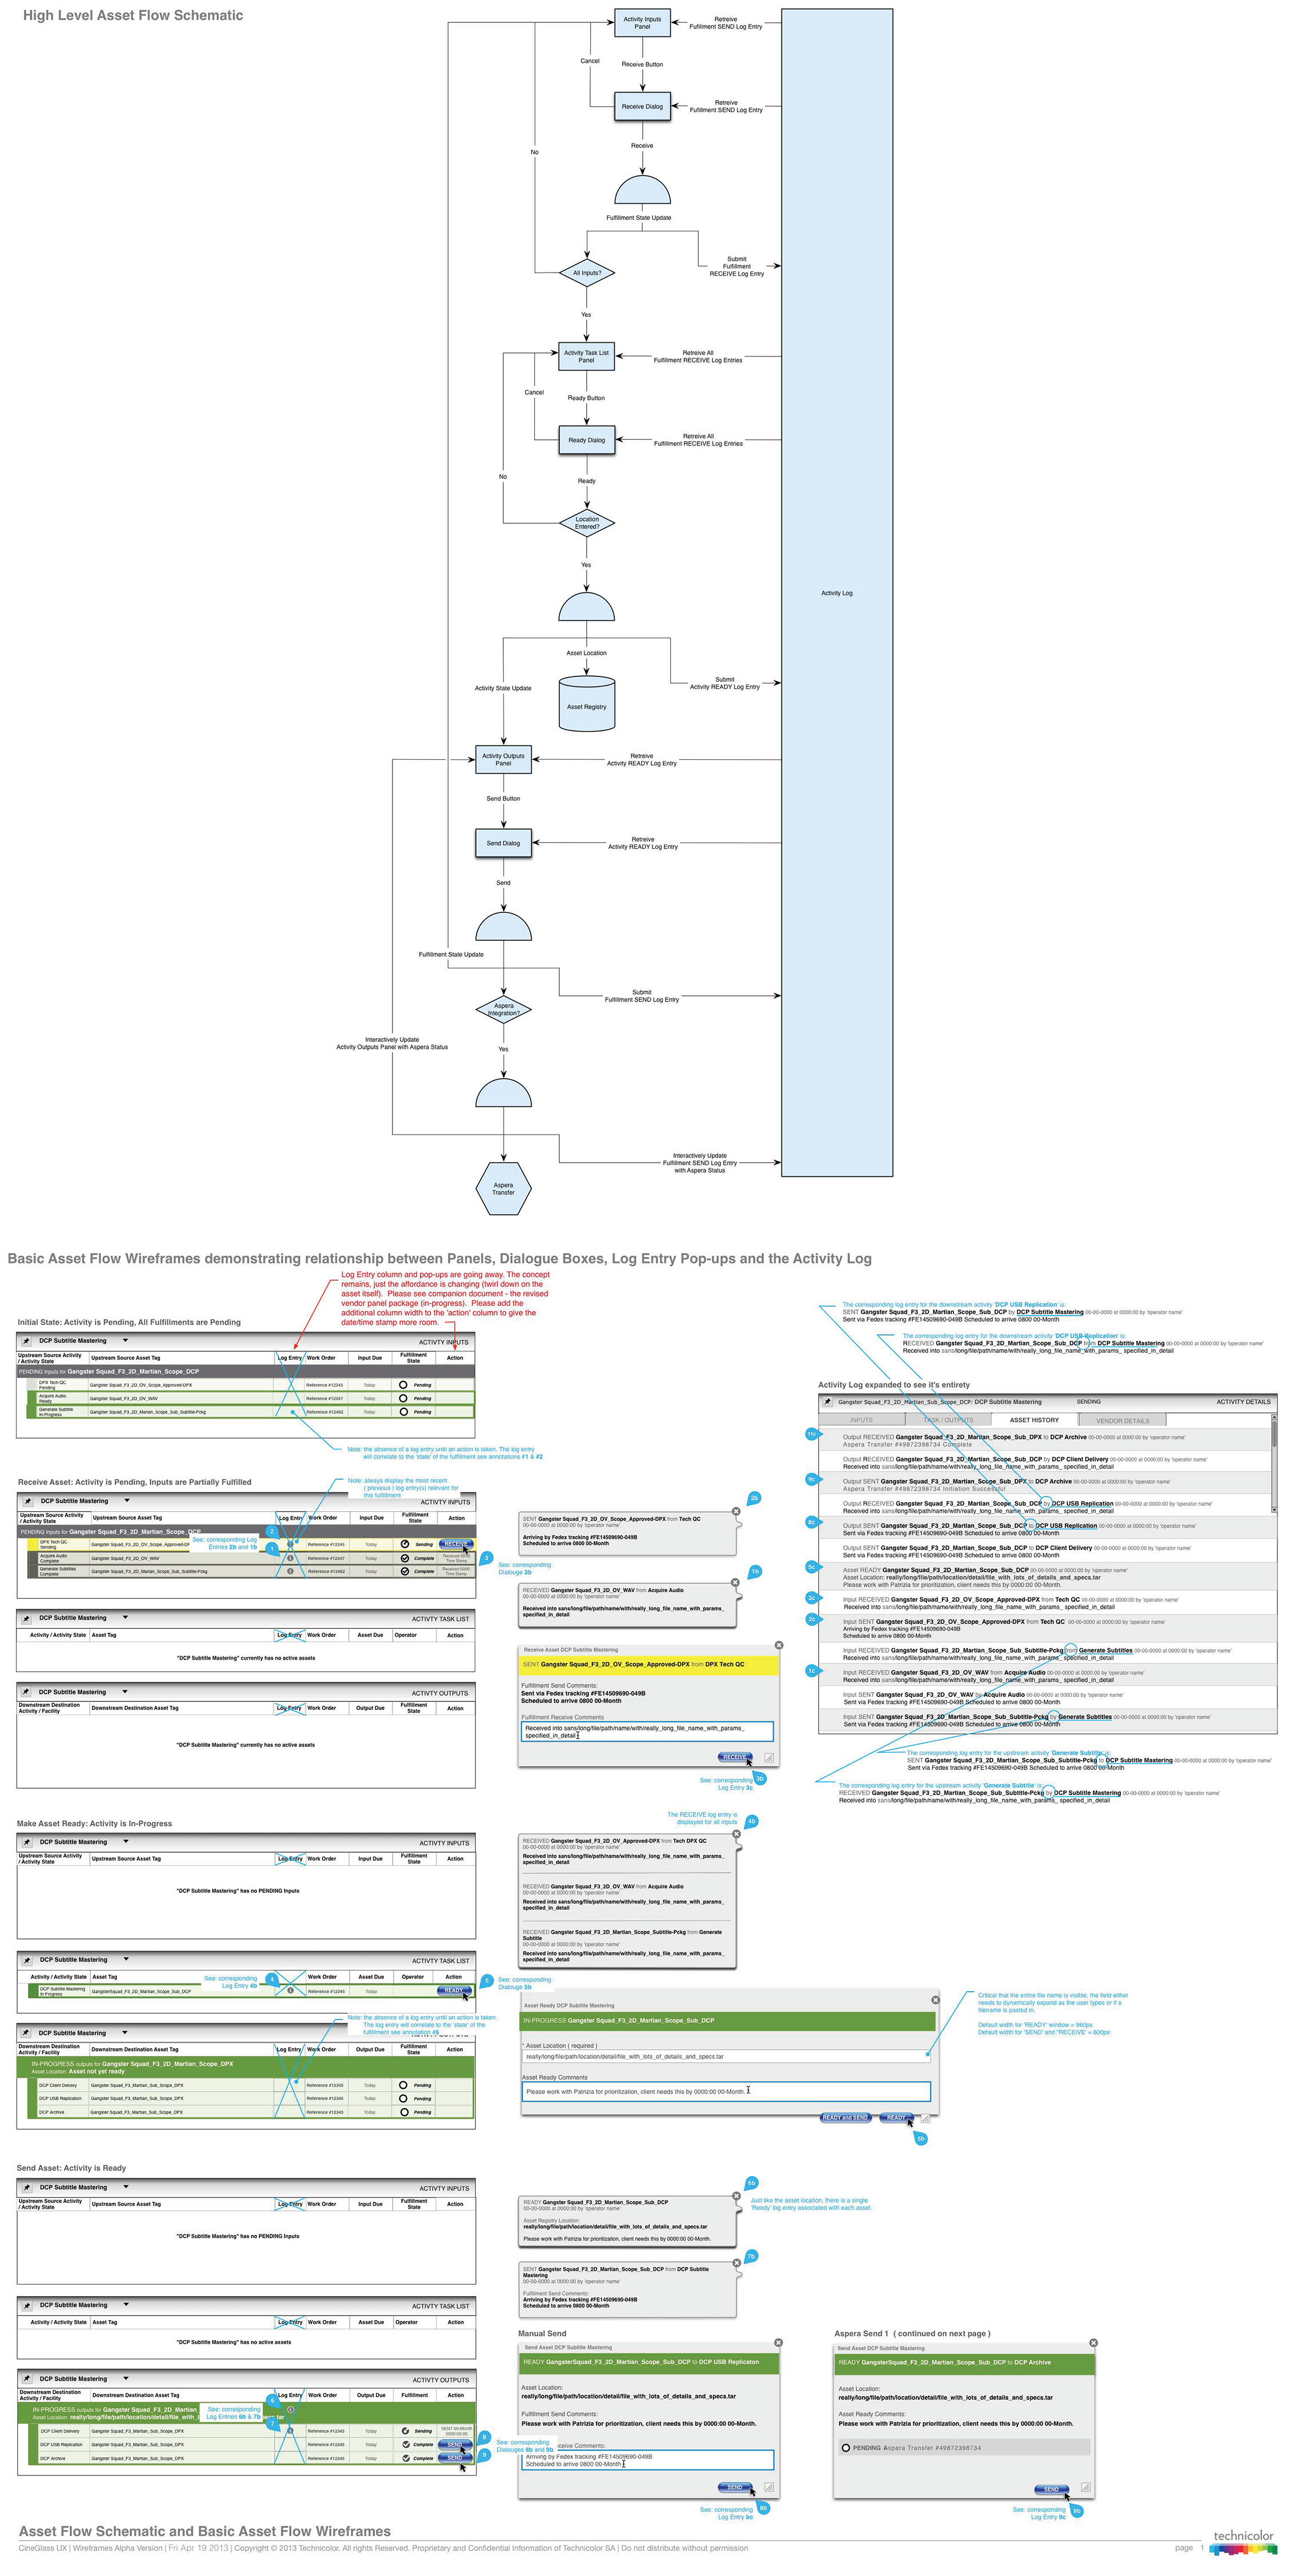
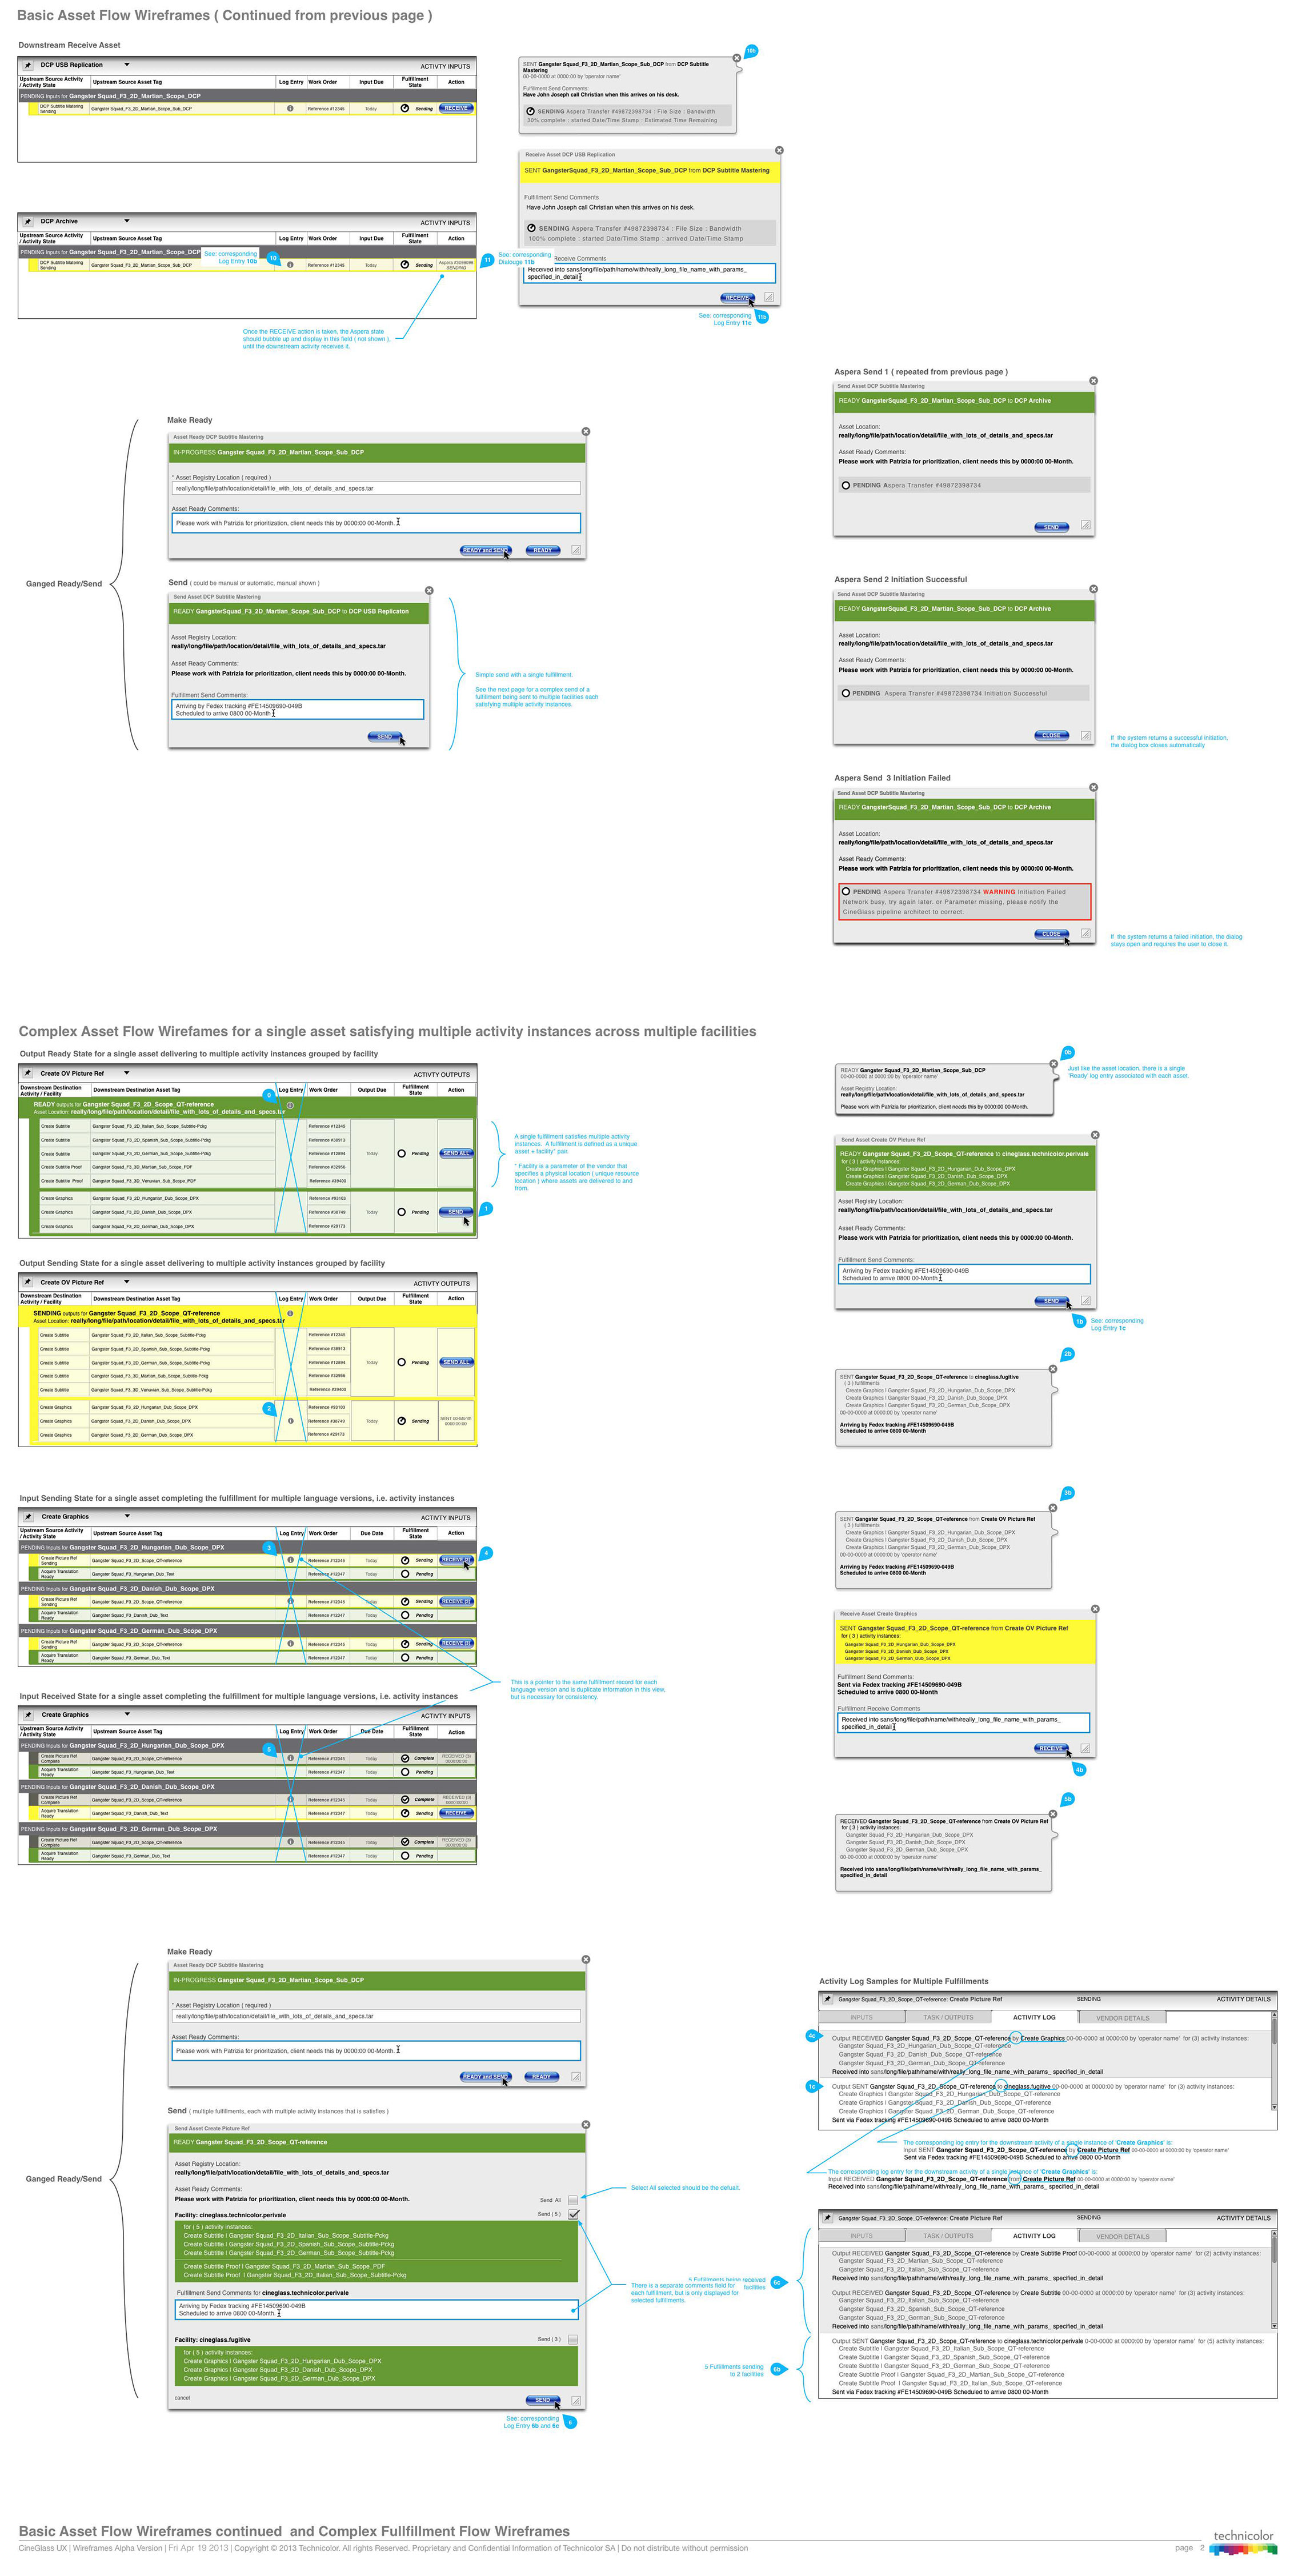
Pipeline Workflow Diagram
The pipeline workflow diagram was a key document that provided clarifty about the asset flow for the entire team. Having internalized this workflow is what led to my final breakthrough dashboard design solution which ultimately mimicked the user's mental model.
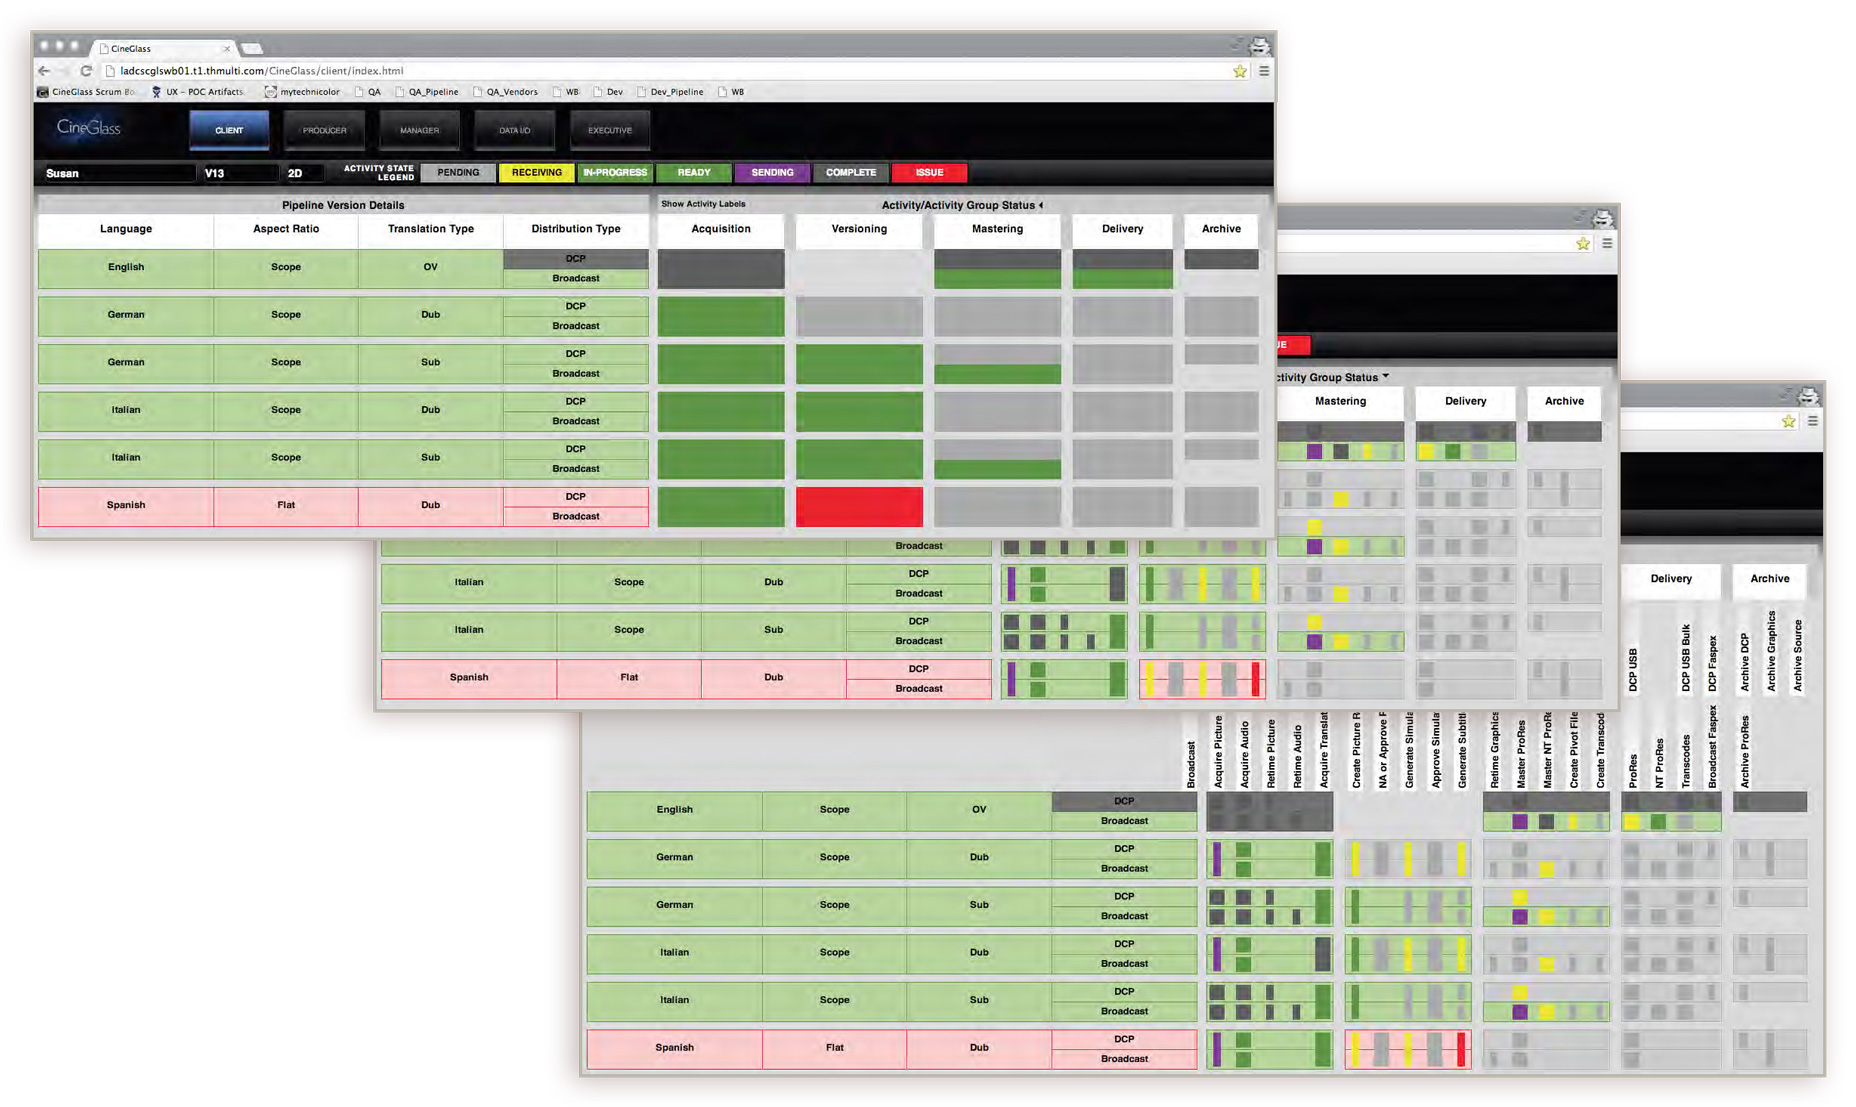
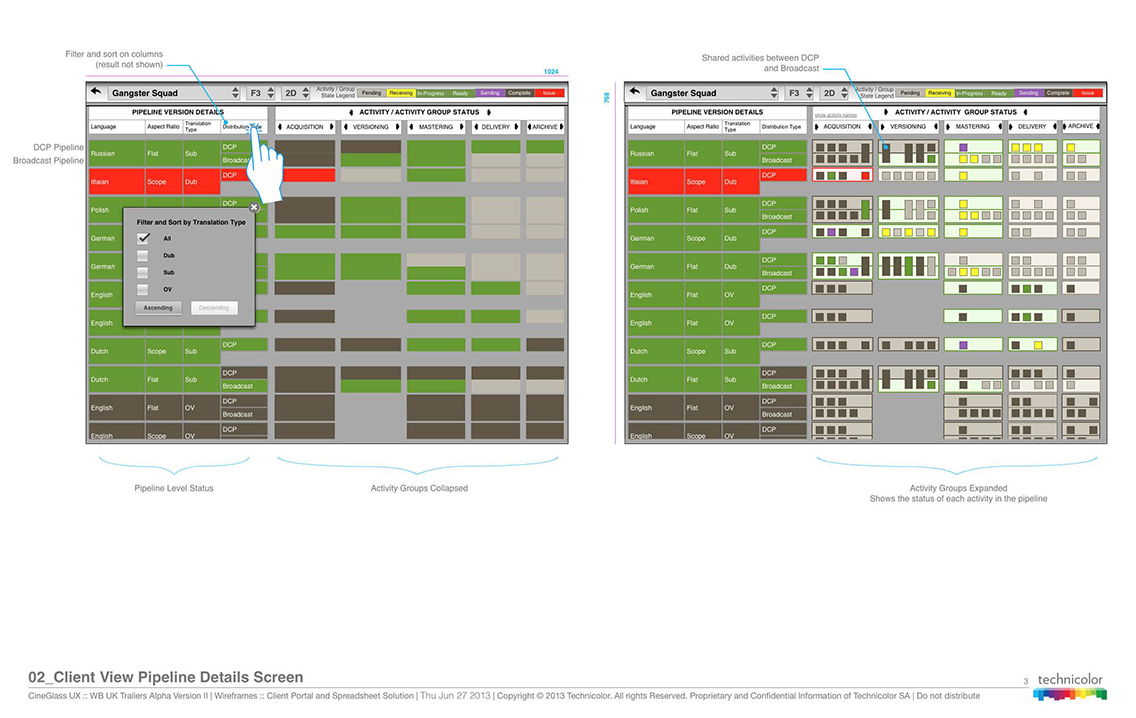
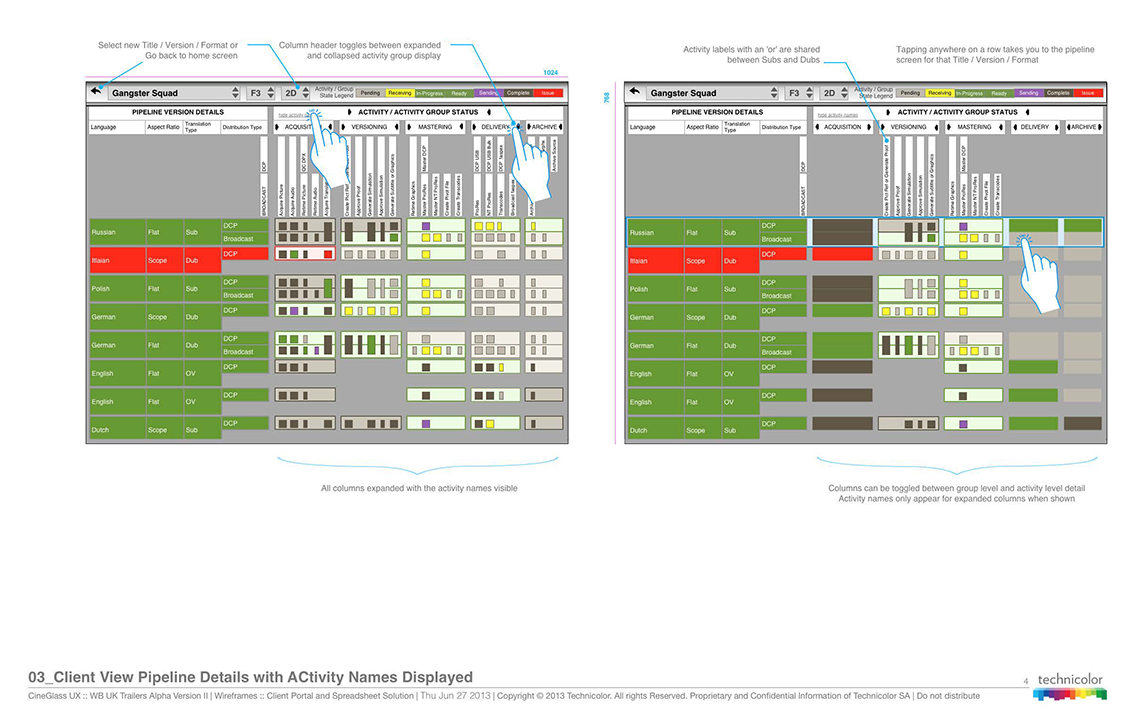
Producer’s View
The producer's view was the view that we worked the longest and hardest to solve. We knew we needed visibility into the pipeline at key activities plus a dashboard view that indicated the state of each key activity.
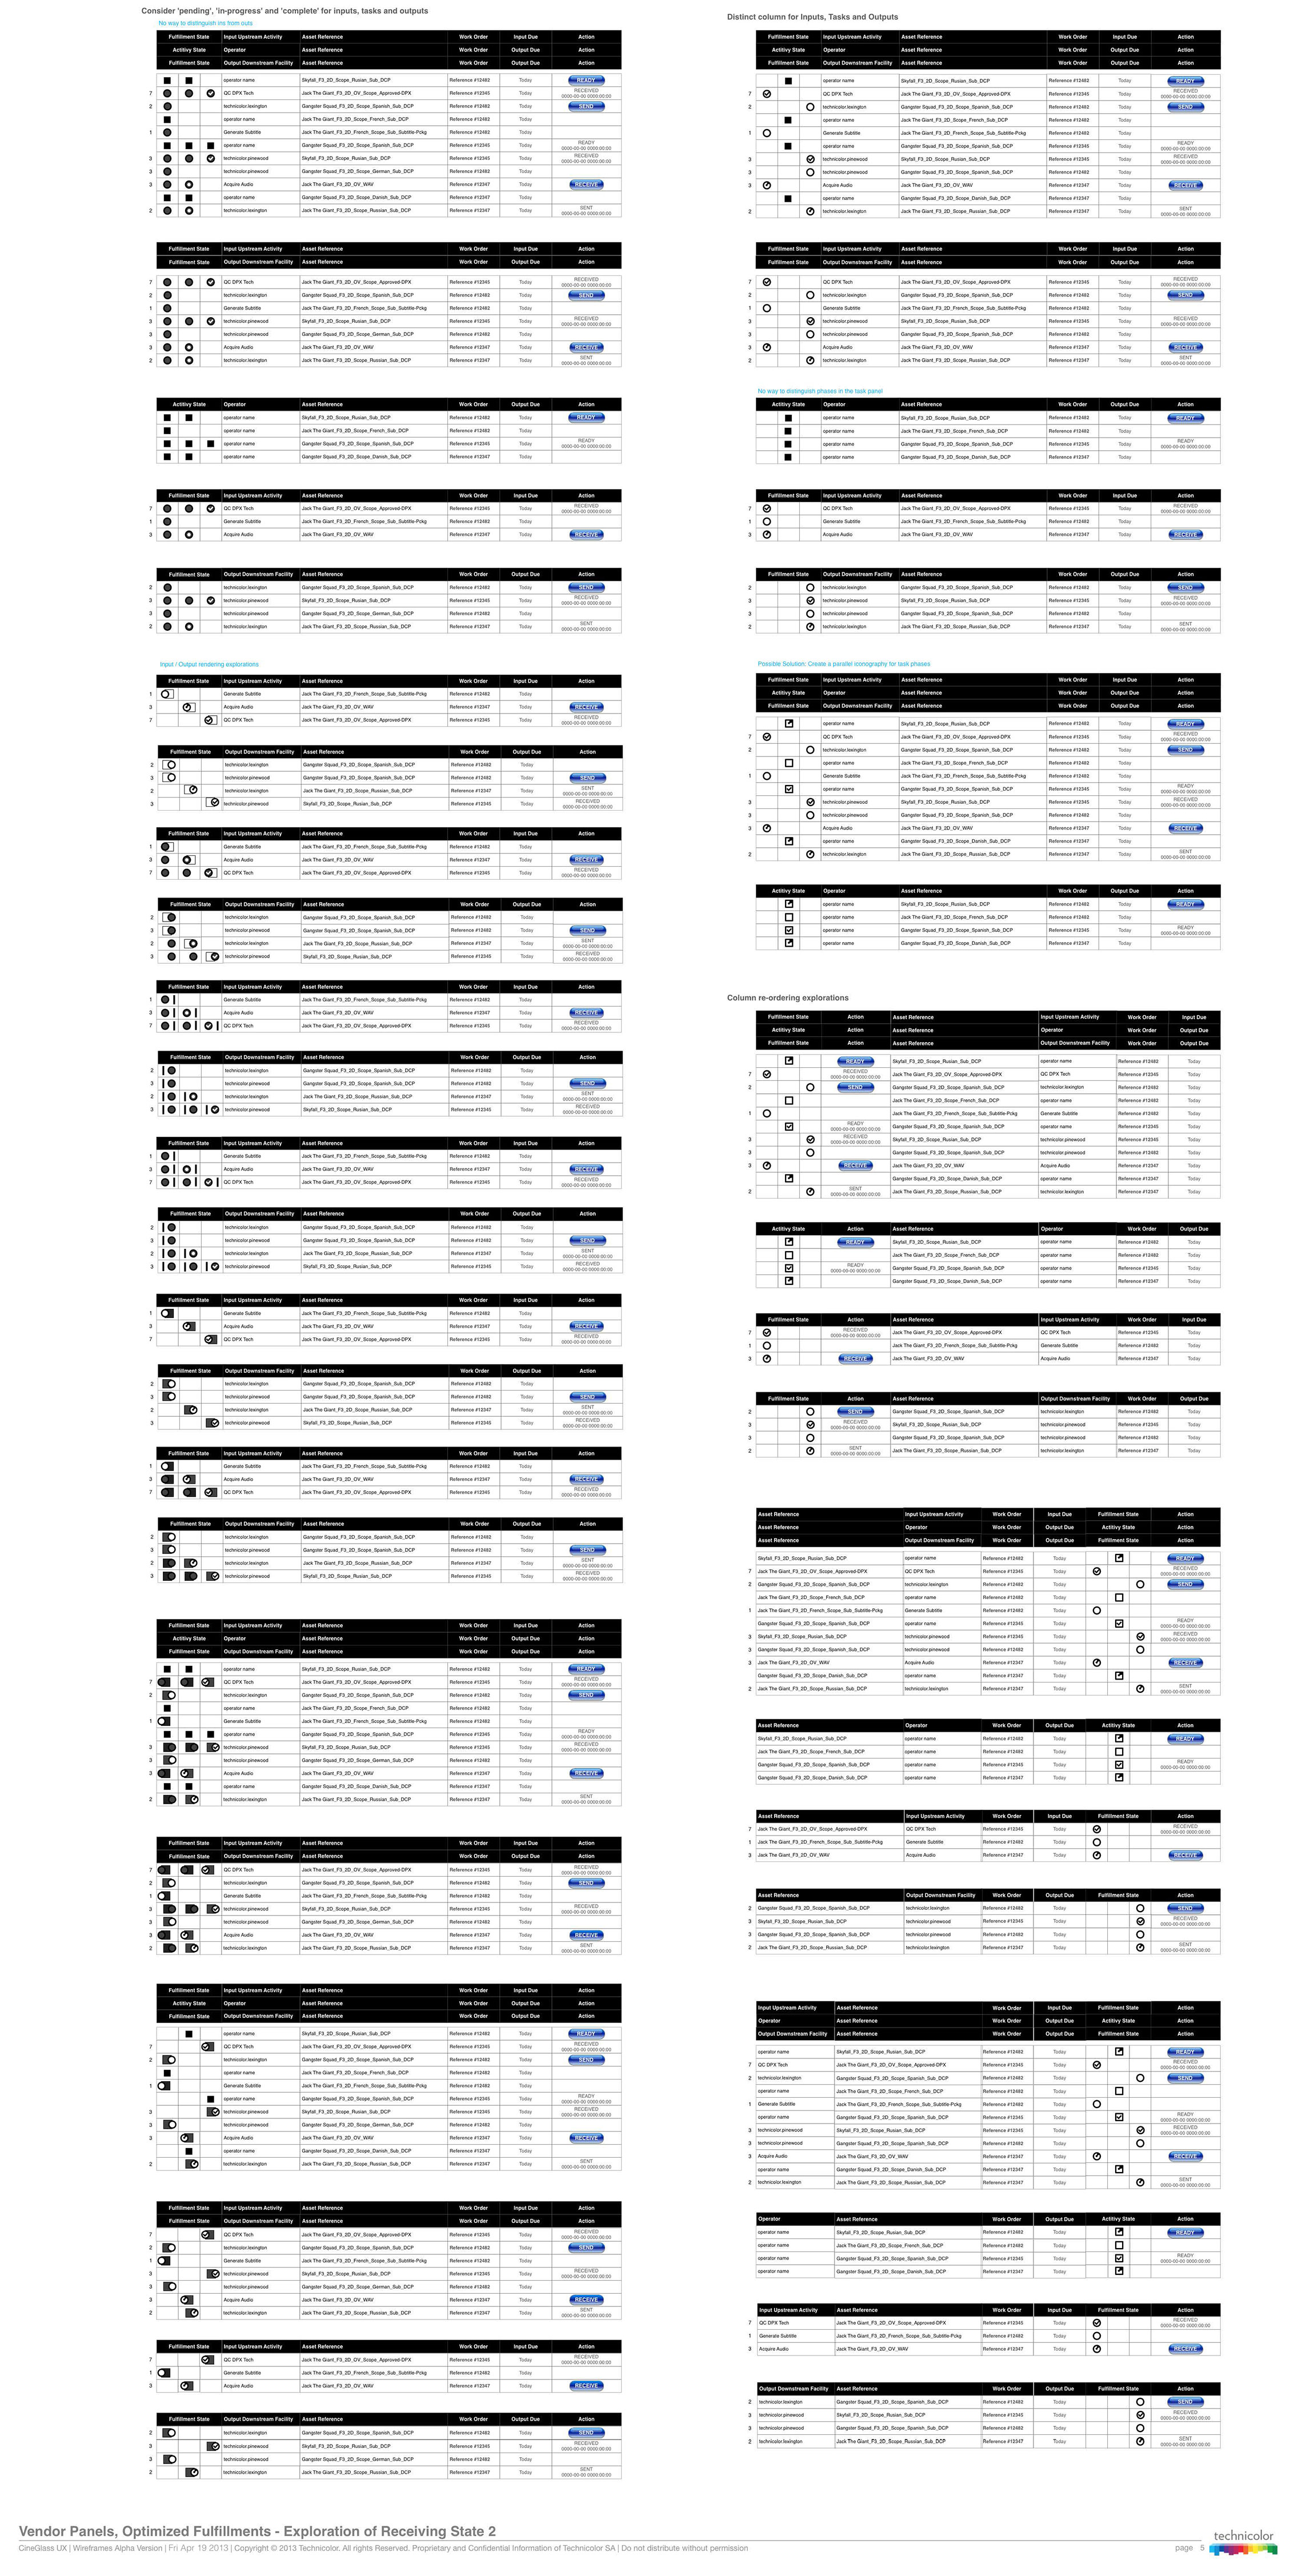
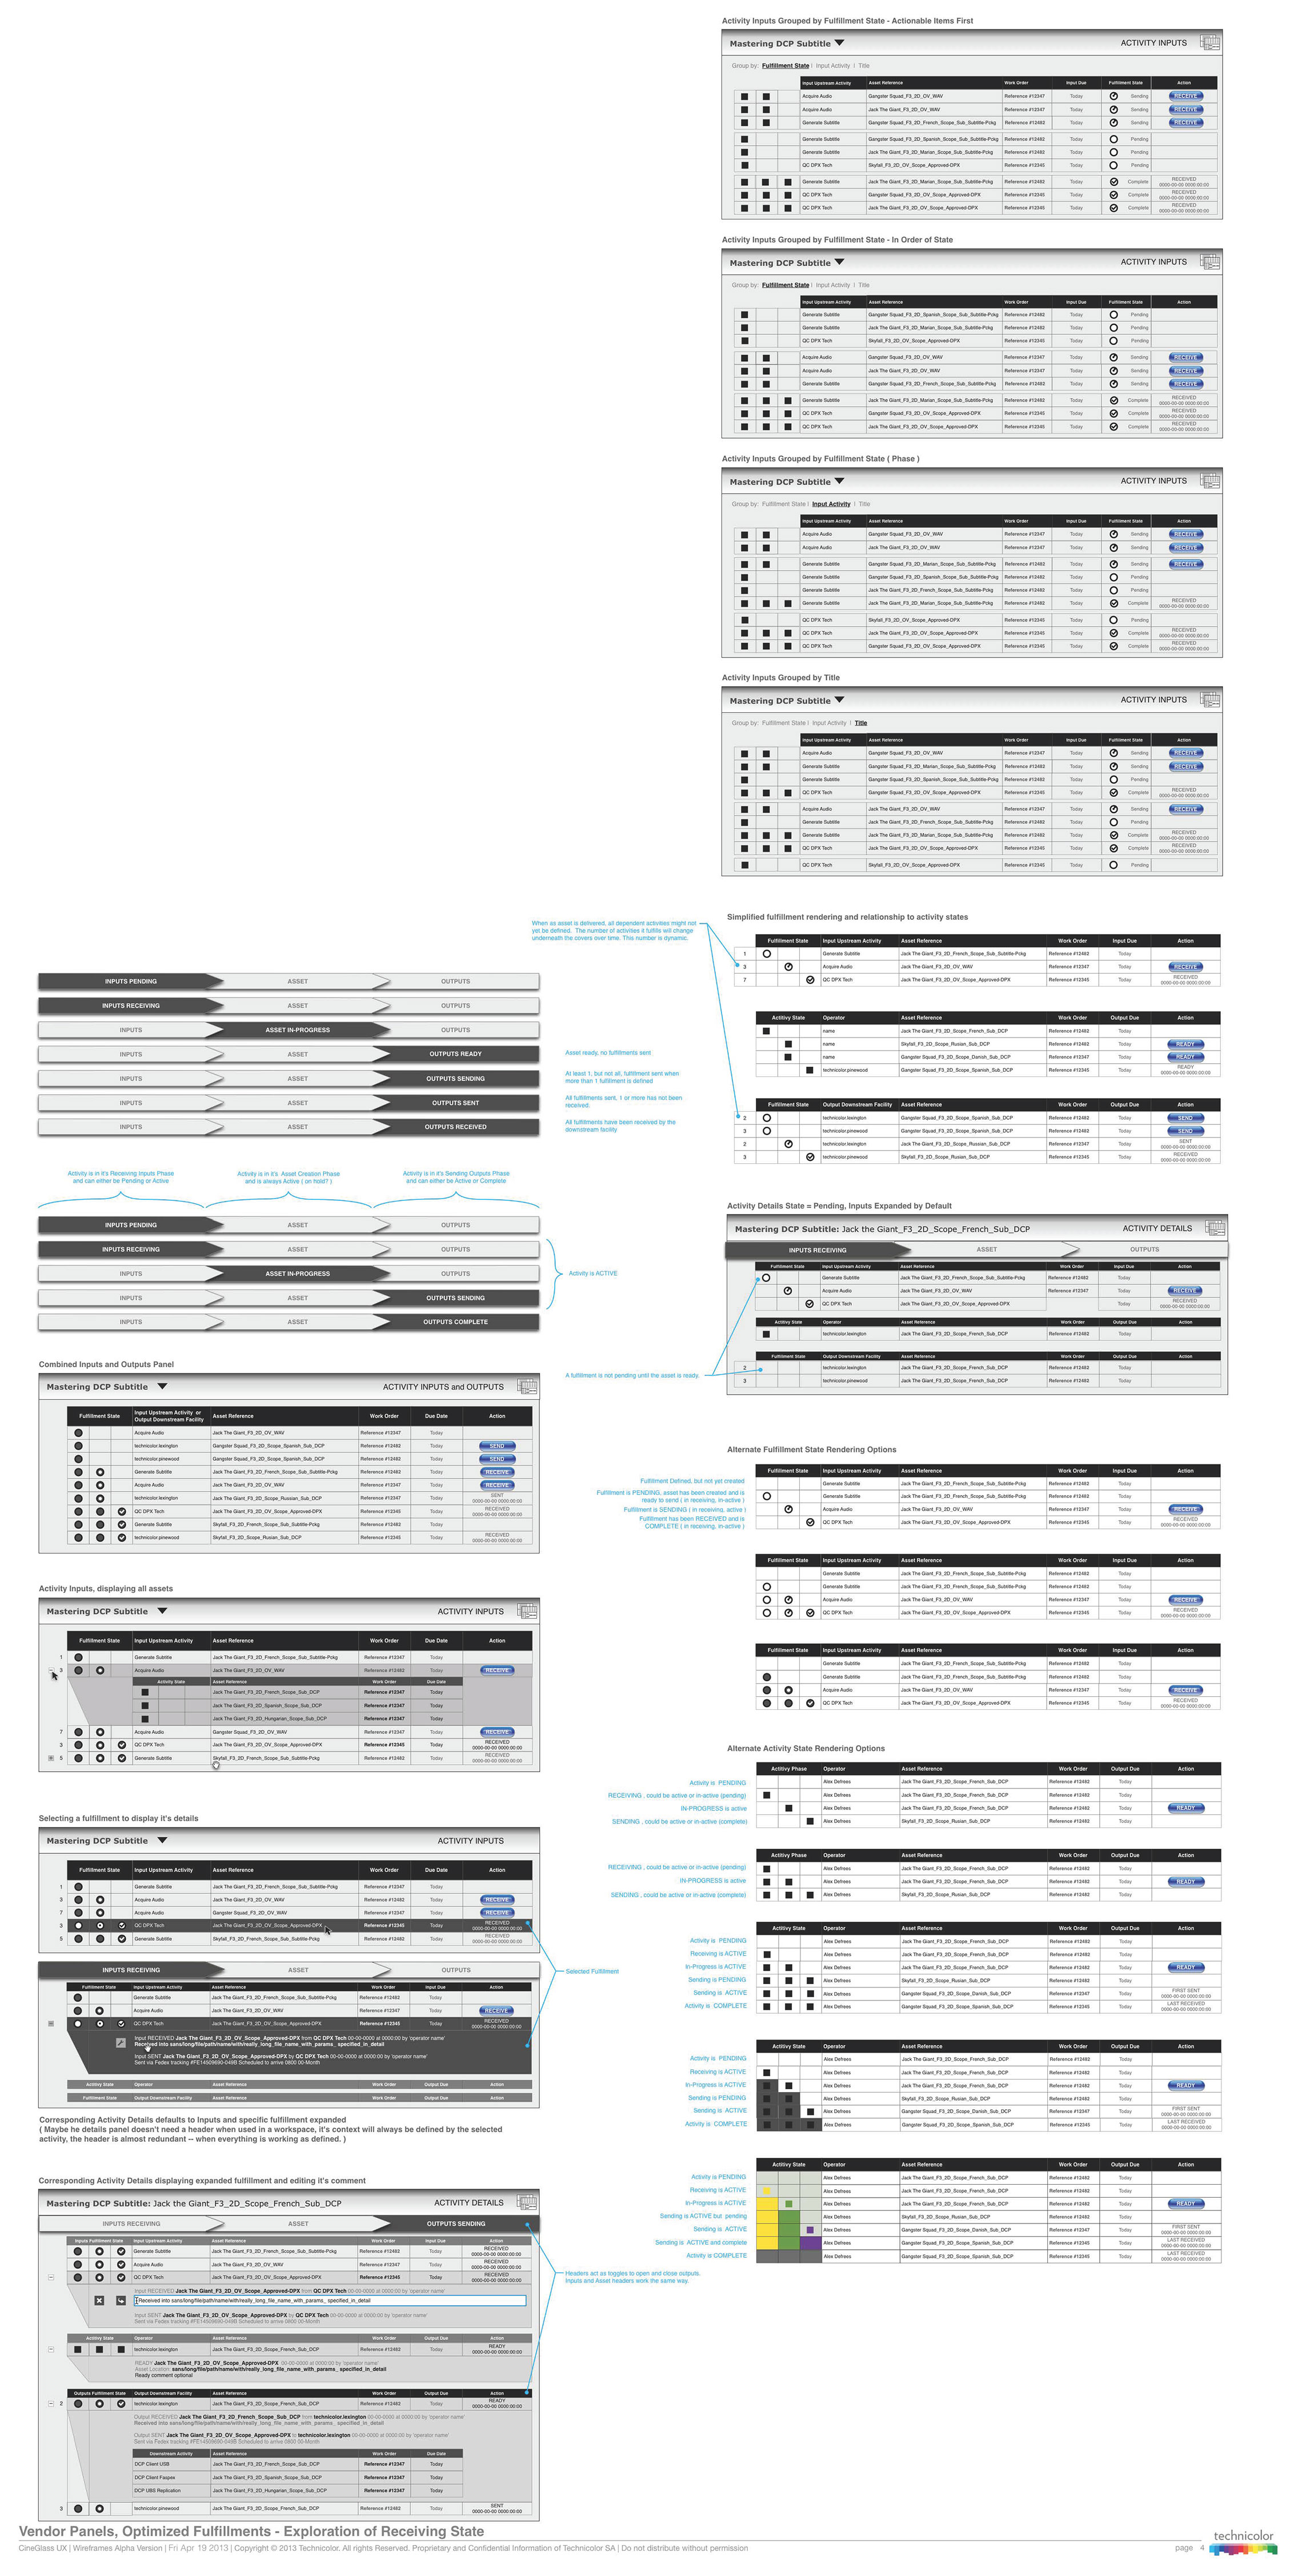
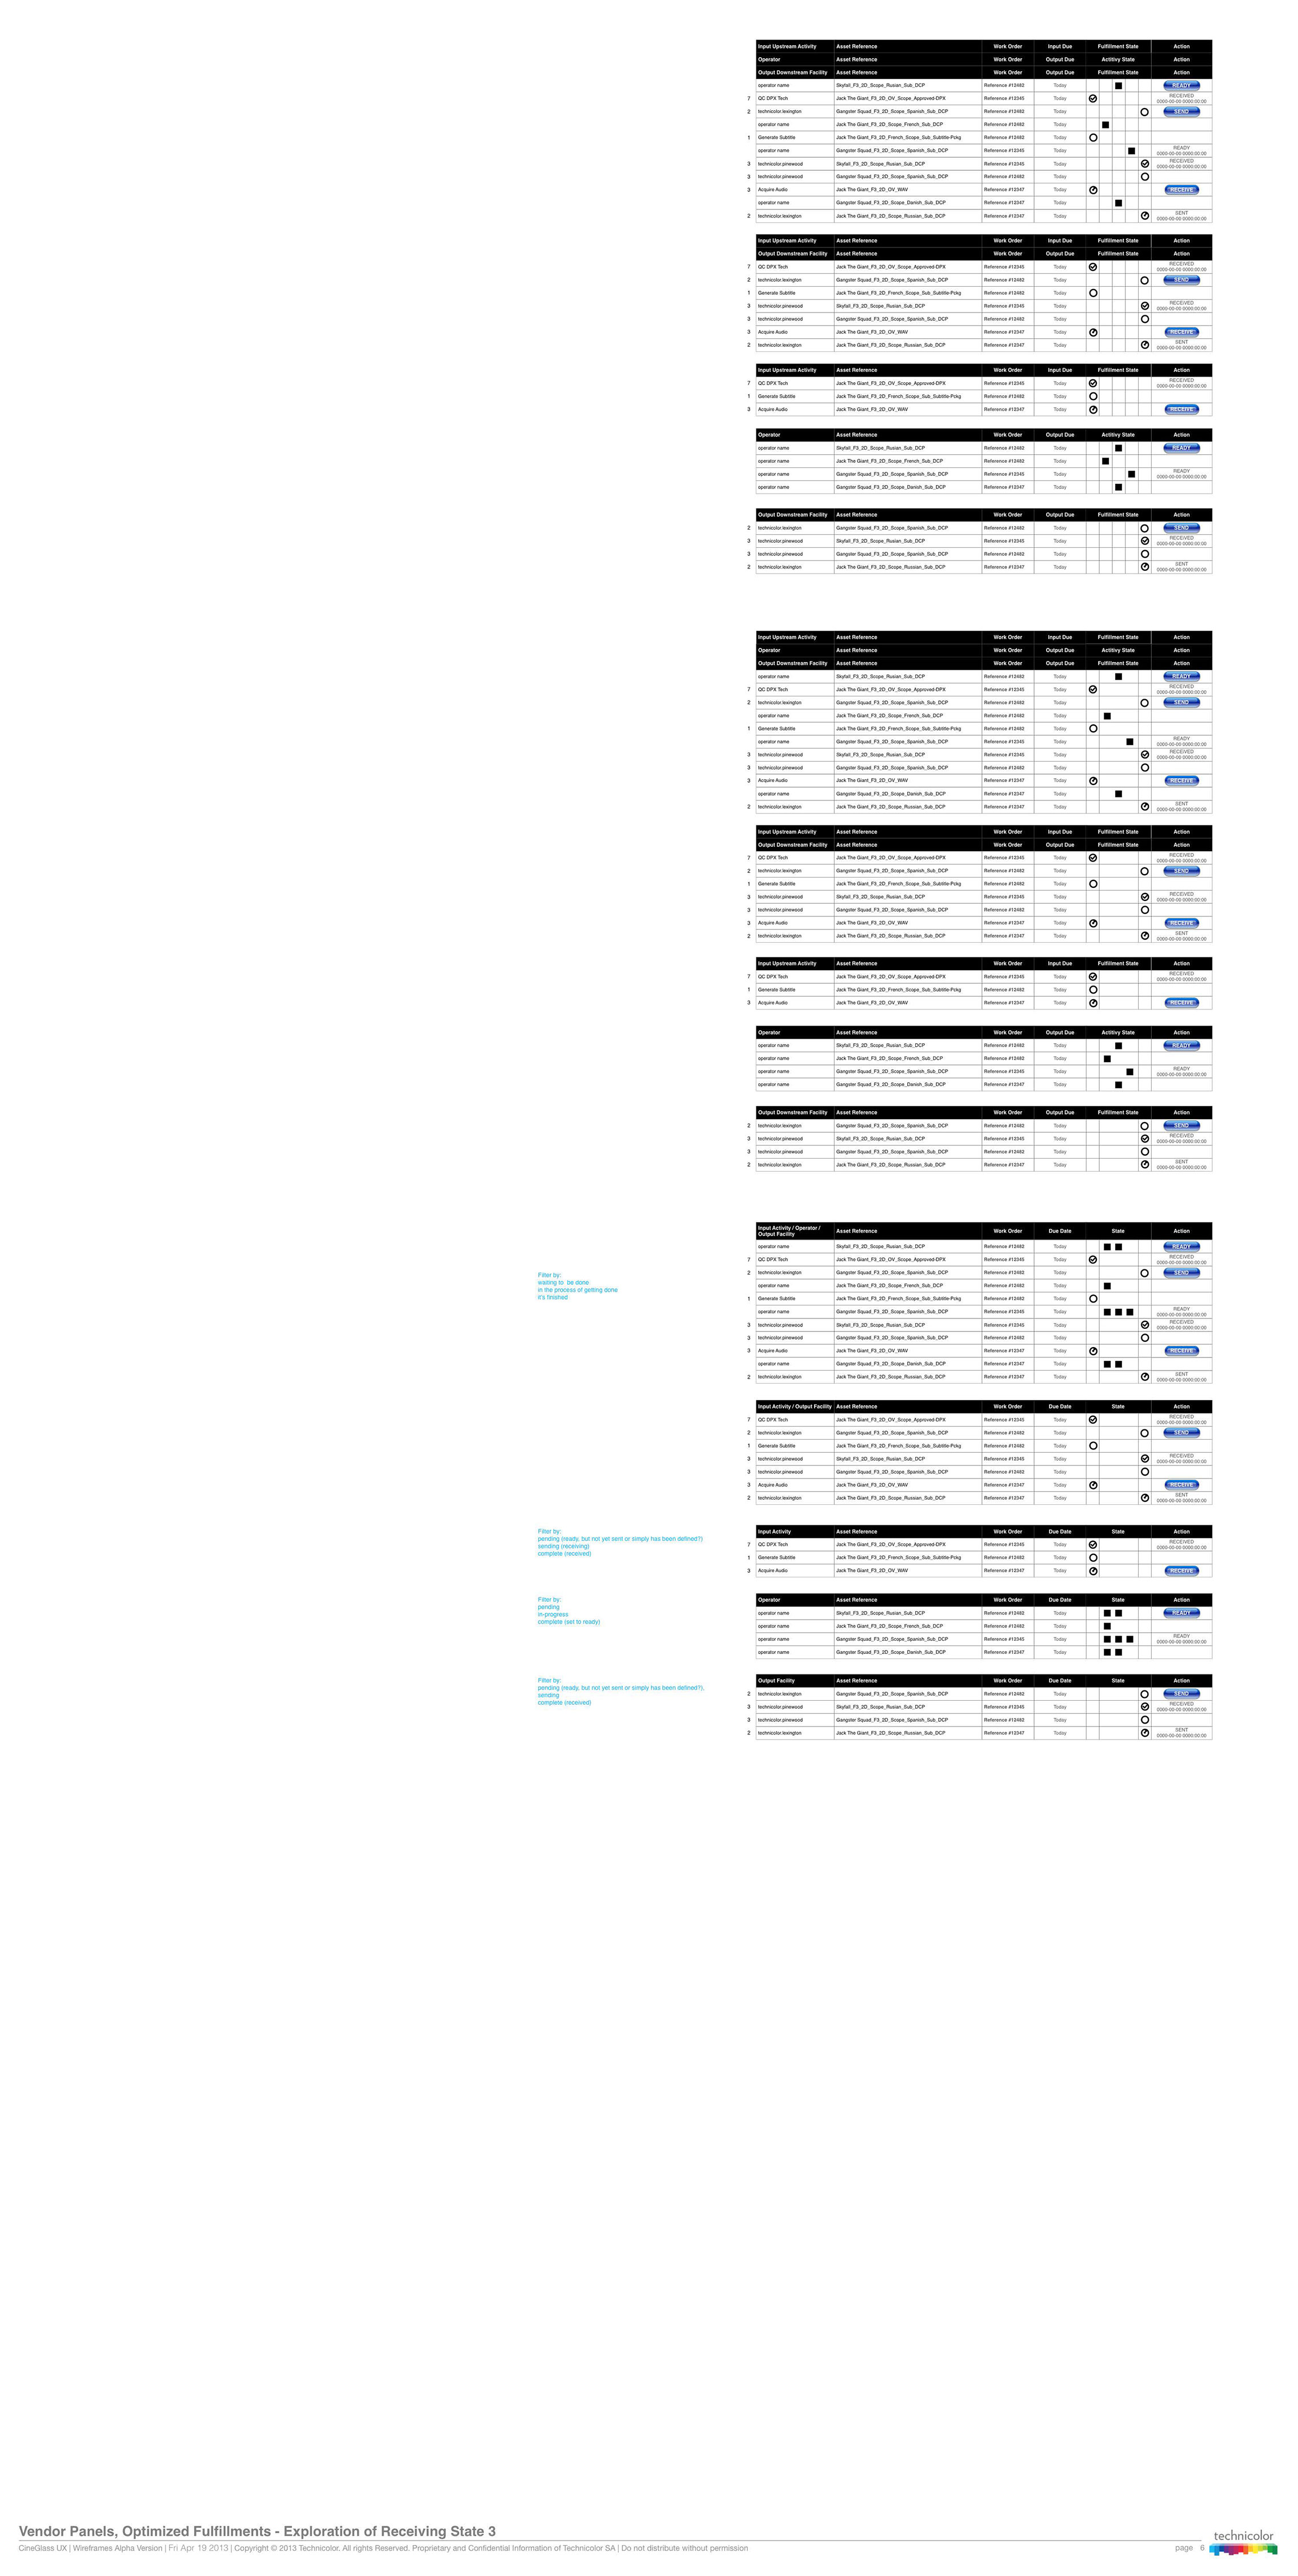
Vendor View
We realized that a single vendor view with detailed asset visibility would be appropriate for all vendor roles. This was a simplification from our intitial assumptions.
Executive View
A simple high level view providing insight to the overall health of the pipeline itself indicating where, if any, problems existed.
Research Analysis
With a detailed understanding of the work environment, the needs of each actor, the complexities of the workflow, the under pinning technology, and the business requirements, I was able to design a set of dashboards to meet the unique and shared needs of each role, or persona.
Visualizing the research findings for myself, and the team, helped to make the connection between the user and the design choices being made.
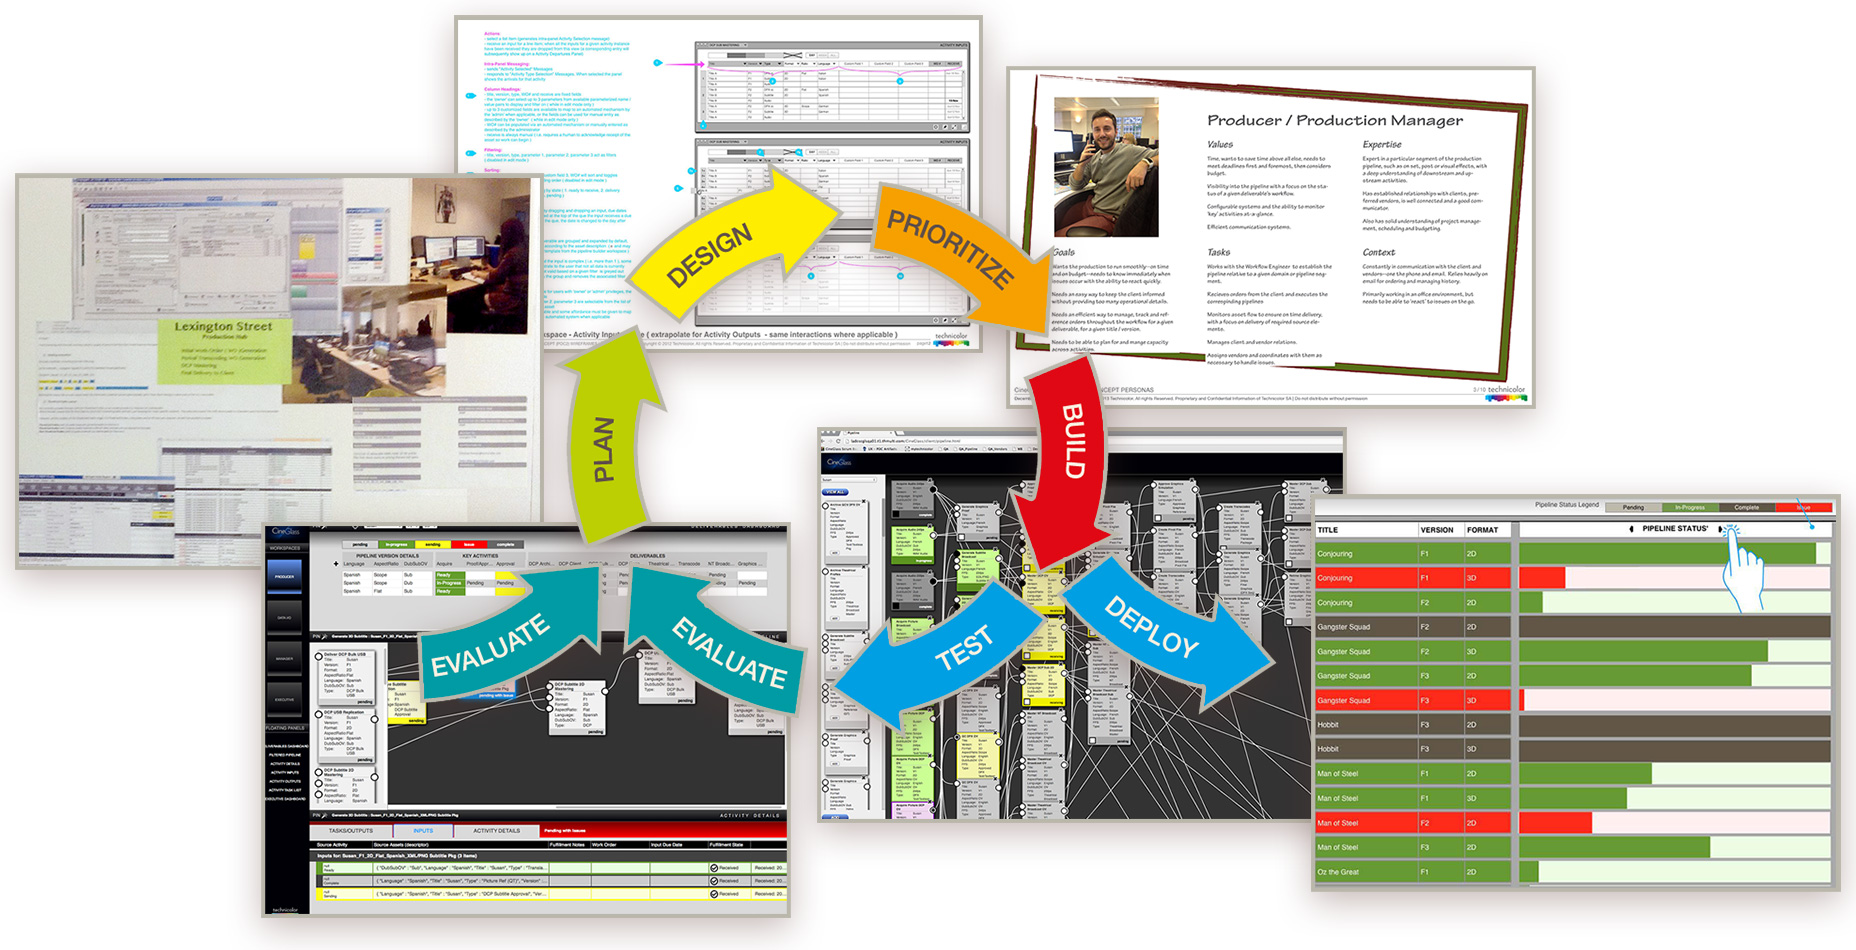
Iteration
We ideated, built, and tested rapidly so that our ideas were tested as the product was being built. User research and testing happened in a parallel track to development. The constant feedback loop ensured we:
- best understood the user.
- built the best product.
- ensured a well-defined and well-tested product/market fit.
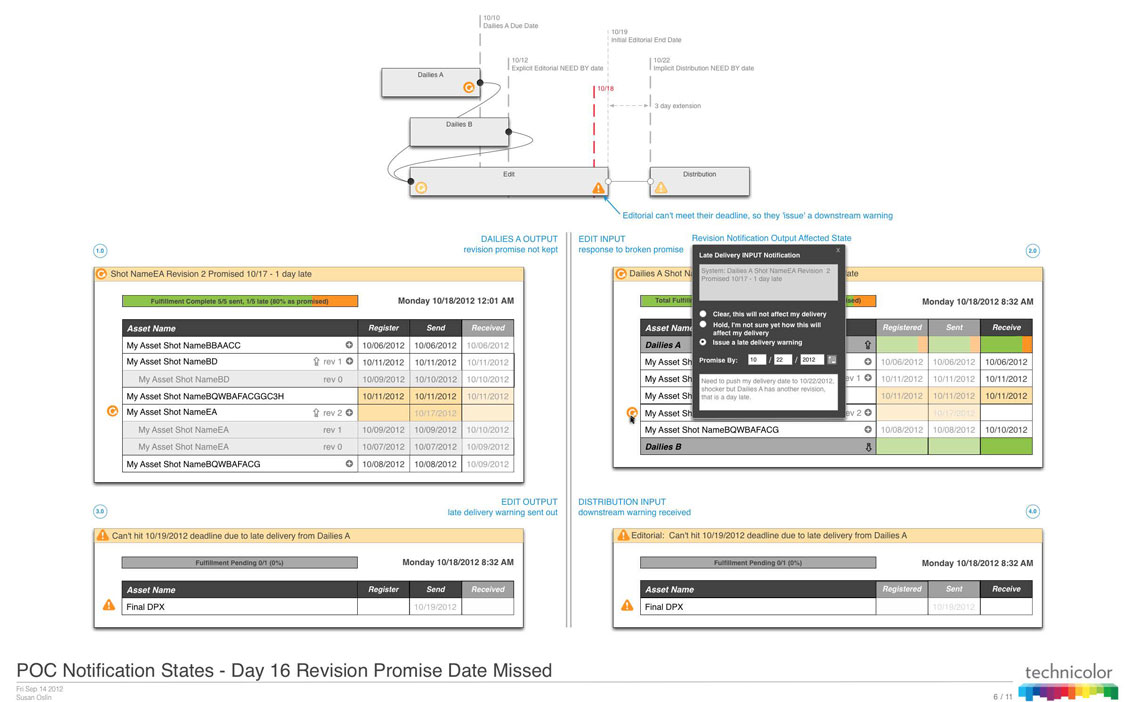
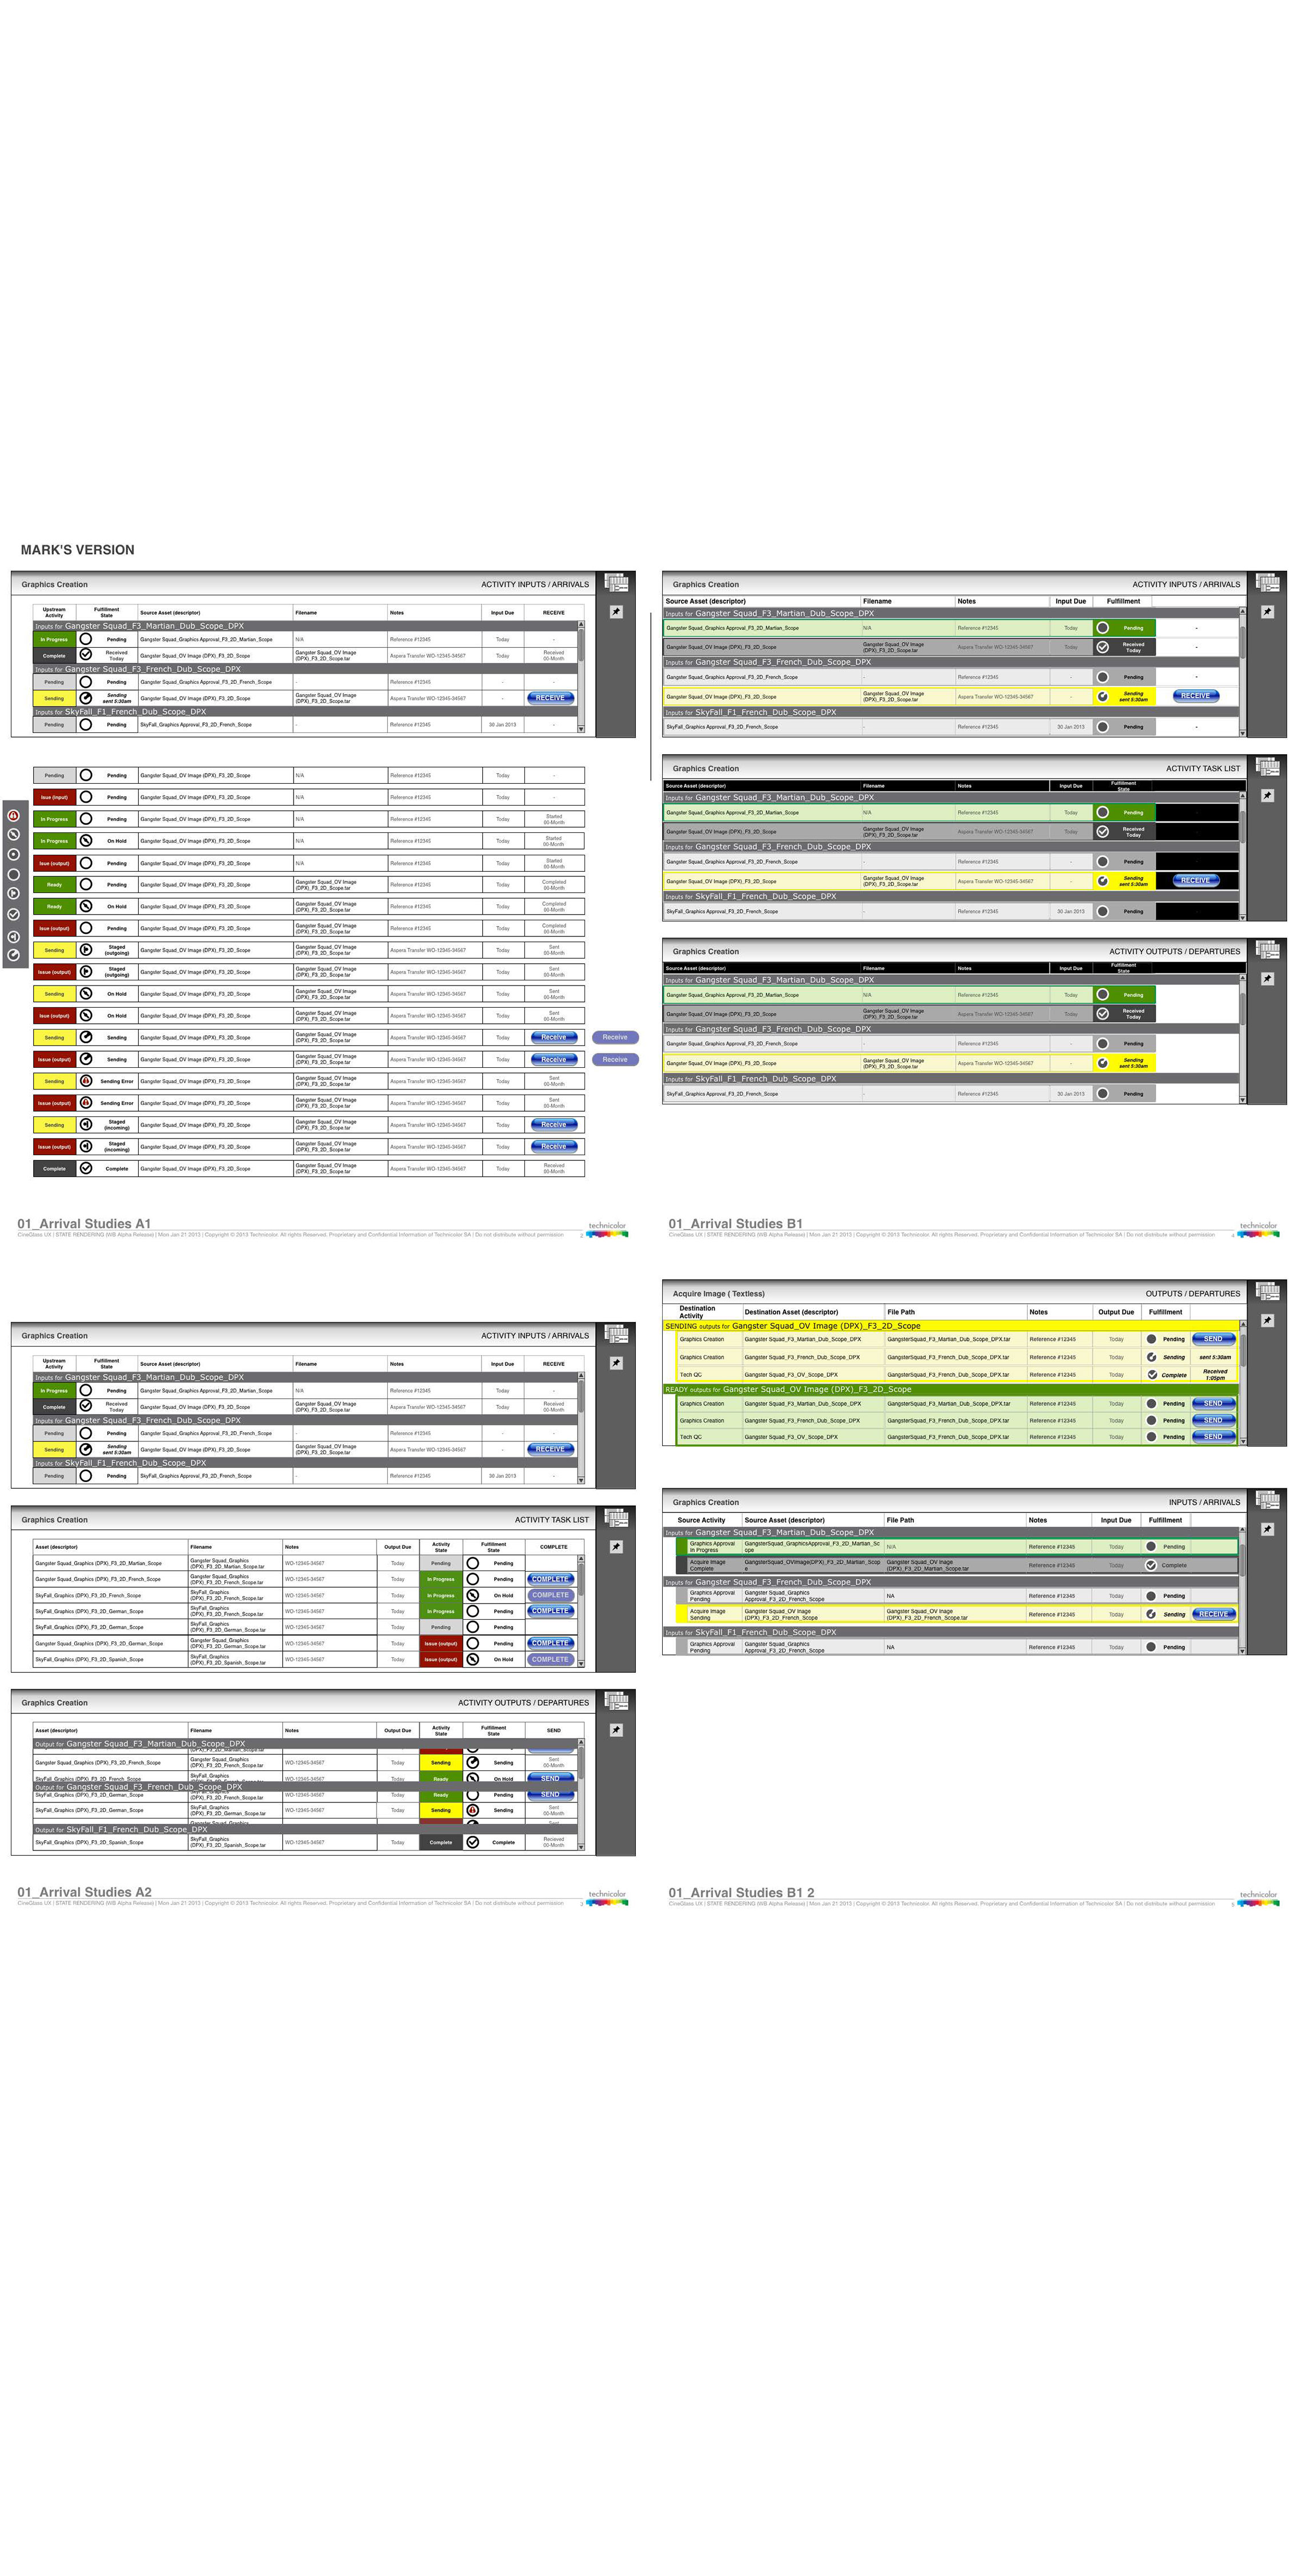
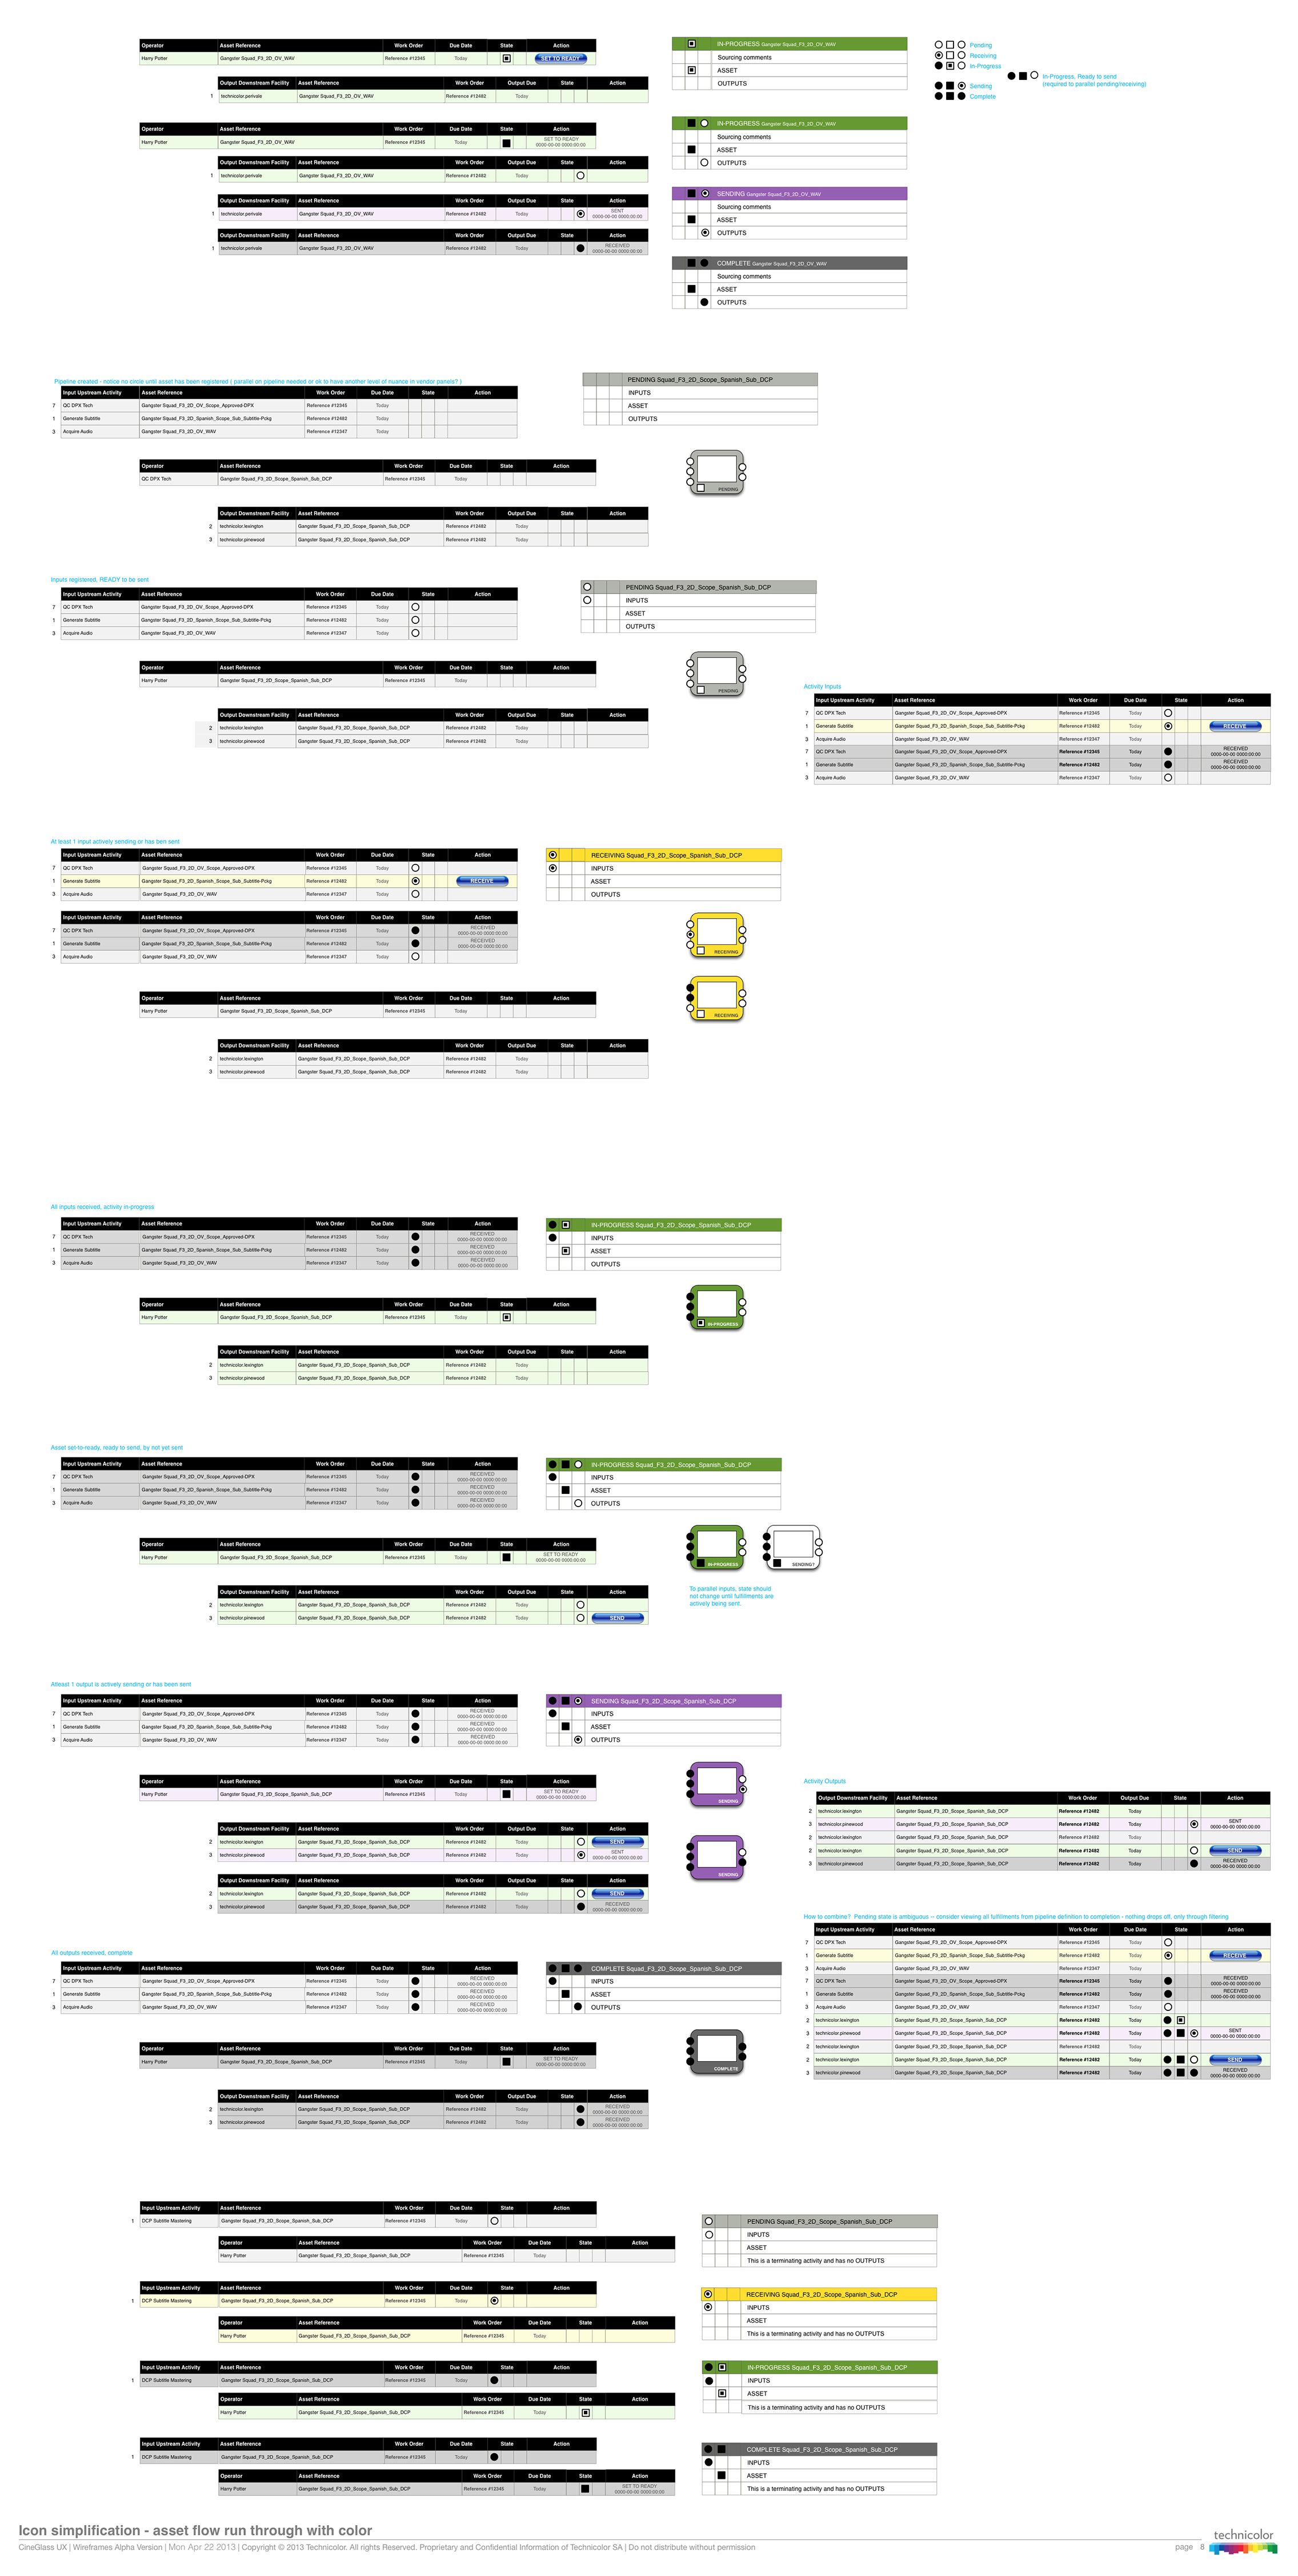
System State Diagram
Our goal was always to acheive “at-a-glance” visibility. The incography for the states needed to be simple, bold an informative. State design was also integral to the design of the other dashboards.


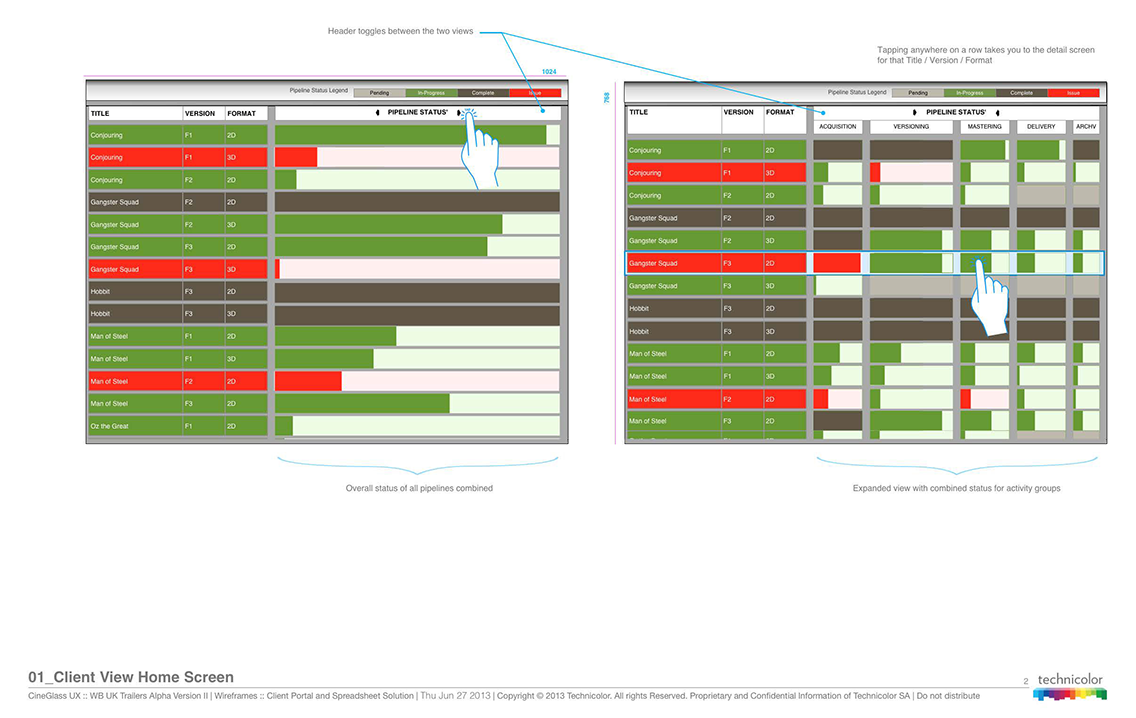
Deliverables Dashboard
The producer had provided his idea for what he thought he wanted for the deliverables dashboard. Even after many iterations, in the end this did not prove to be the most effective solution.
Arrivals and Departures
The importance of this view was the primary nugget we returned with from our initial research. The Arrivals and Departures Dashboard drove the iconography of the state more than any.
Production Pipeline
What started as the key visual, ended up being the least important. Although still useful, considerable care went into how it would be filtered to be readable.
In-depth Explorations
In between the major milestones displayed above, there were pages and pages of alternatives explored. Here are a few samplings that explored the various relationships between the dashboards, the pipeline, notifcations, and the state.
Lean UX
I used DESIGN TESTS to iteratively test the adjusted hypothesis at all stages of development.
A DESIGN TEST could be:
- solicited feedback on design comps or sketches.
- a wireframe click-through or prototype.
- full-fledged usability testing within a product release cycle.
We did this before the team was heavily invested in the design or code. This makes it easier to adjust or pivot the hypothesis based on user feedback.
Proof of Concept Release
Many elements of the product where working well, but the main dashboard still wasn’t aligned with the client’s expectations. After several sessions together, it became clear to me that the dashboard didn’t match the client’s mental model. The dashboard was inherently linear and the workflow was not that simple. We needed to take a completely fresh approach--it’s never too late to get the product right.
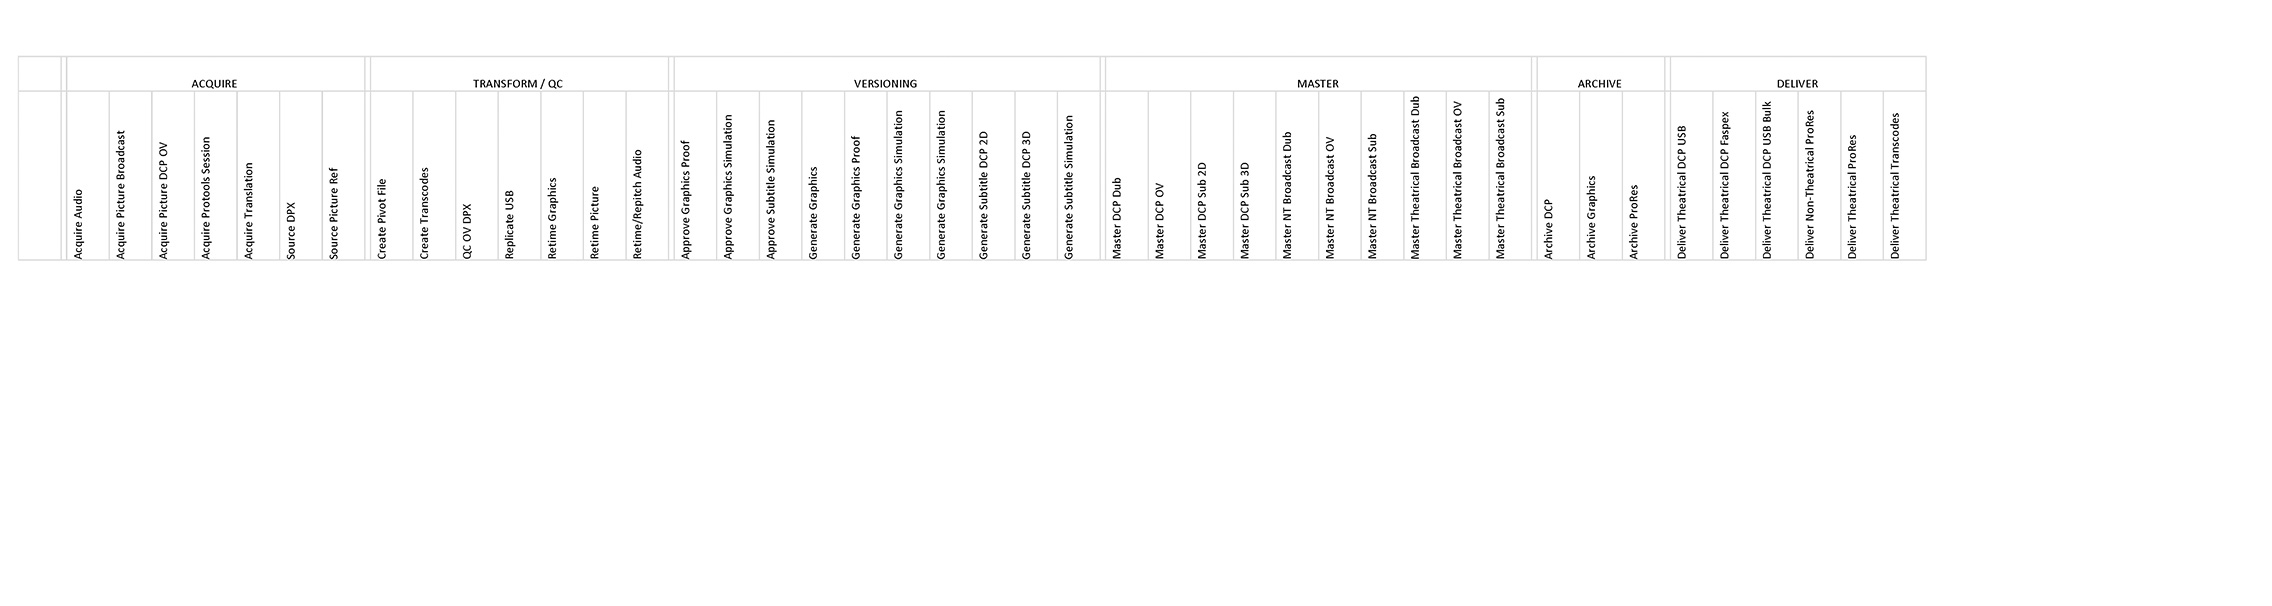
Breakdown, Reorganize, and Regroup
Stepping back with only excel spreadsheets as a tool, I listed out every activity, regrouped, and re-organized based on my understanding of the key needs of the client and the manner in which they were accustomed to thinking about the production.
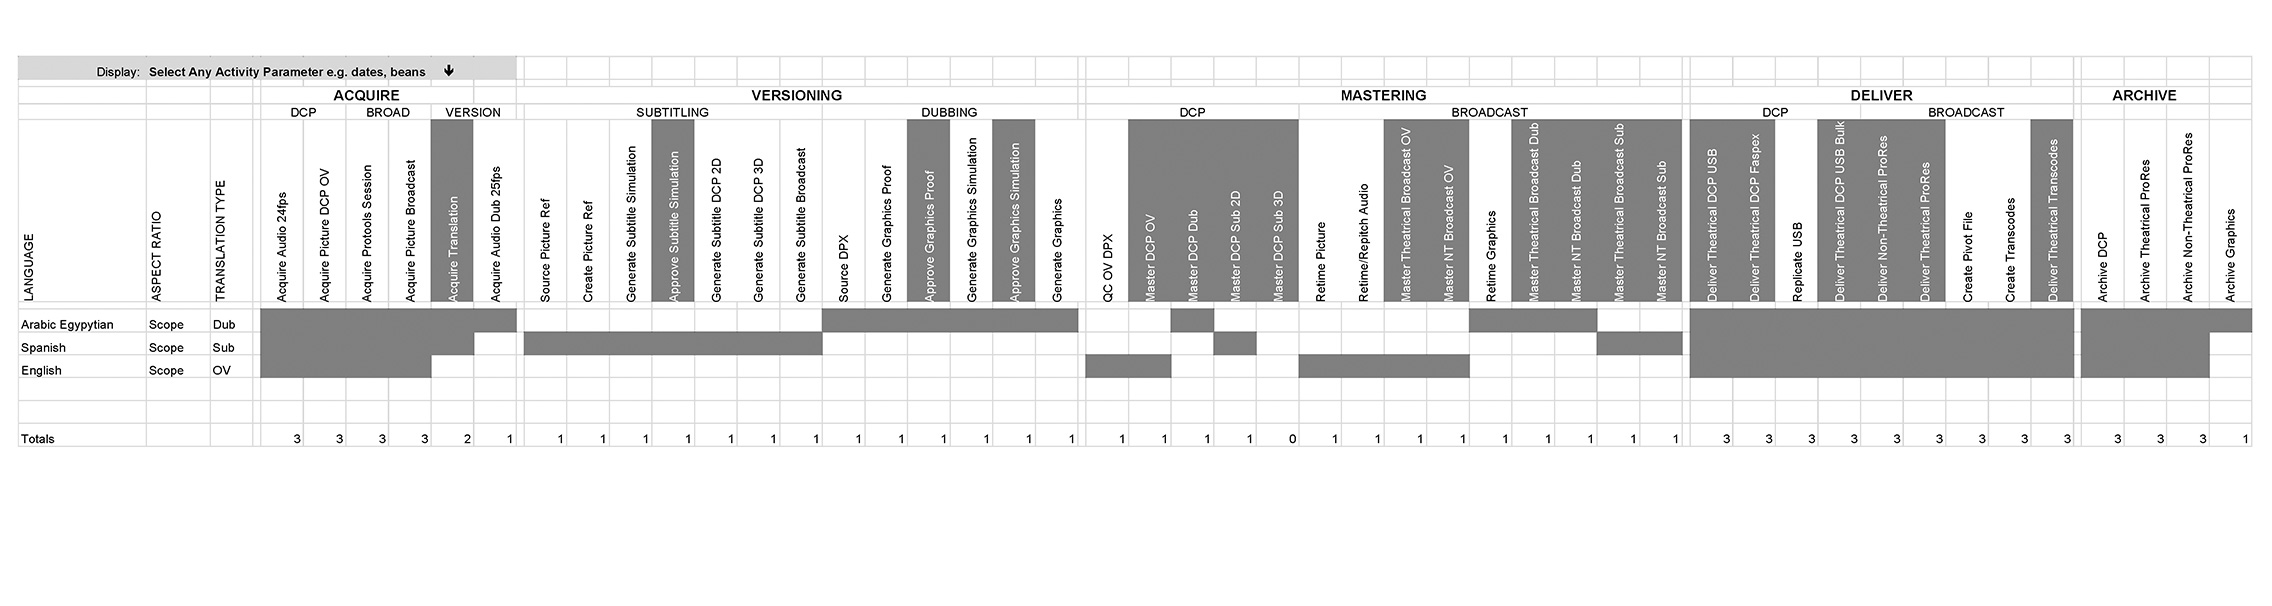
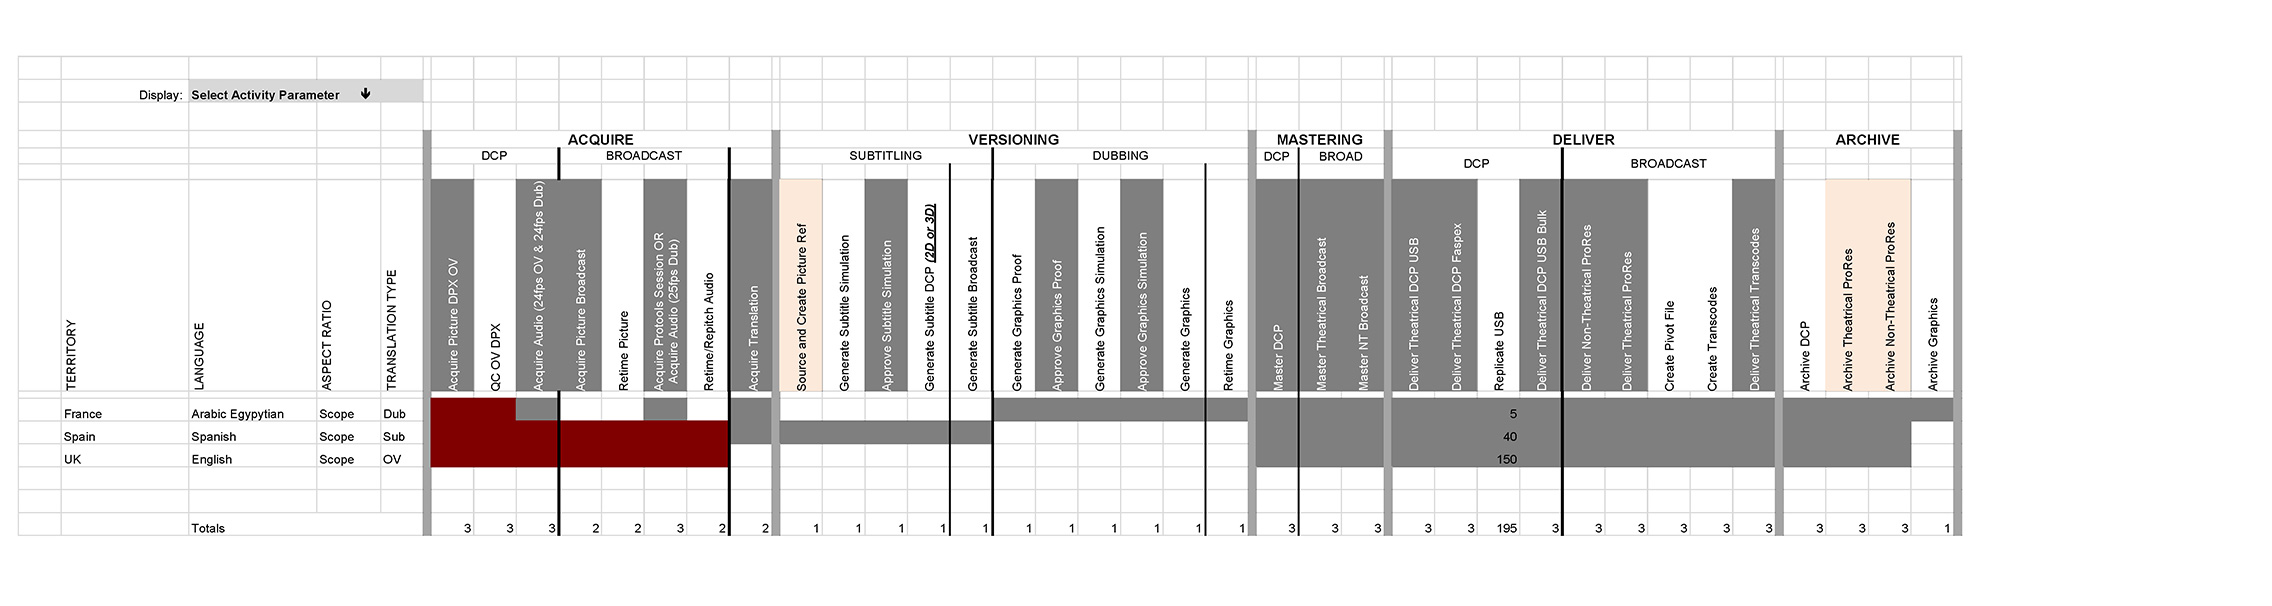
Group by the 3 Key Activities: Source, Translations, DCP
There were two primary concerns for each title production. 1) Knowning when three key activities were complete: Receviing the source files, Translations, and mastering of the DCP...
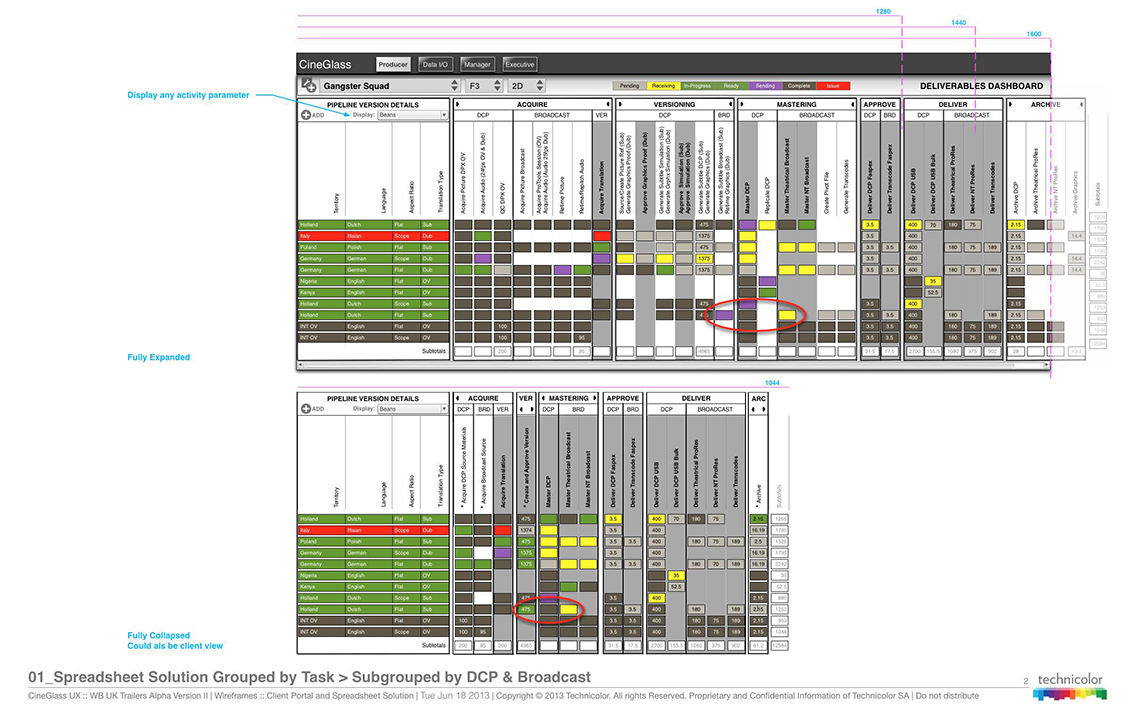
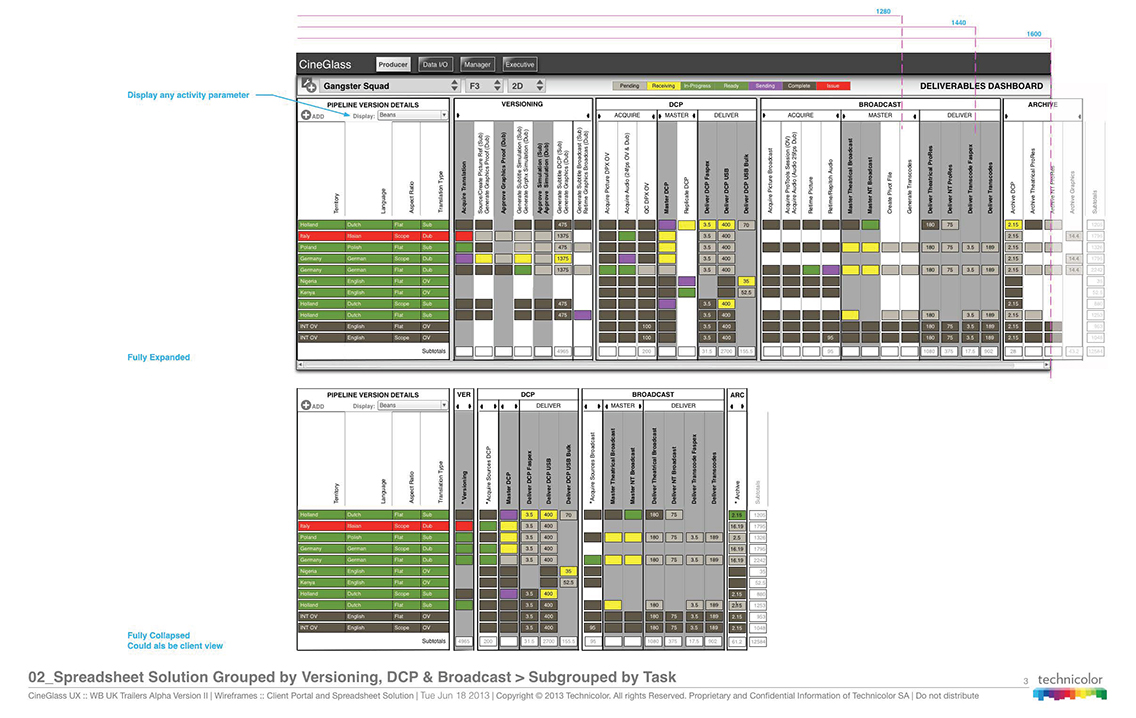
Group by the Formats: Broadcast and DCP
...and 2) being able to track these key activities for the Broadcast version and the Digital Cinema Package.
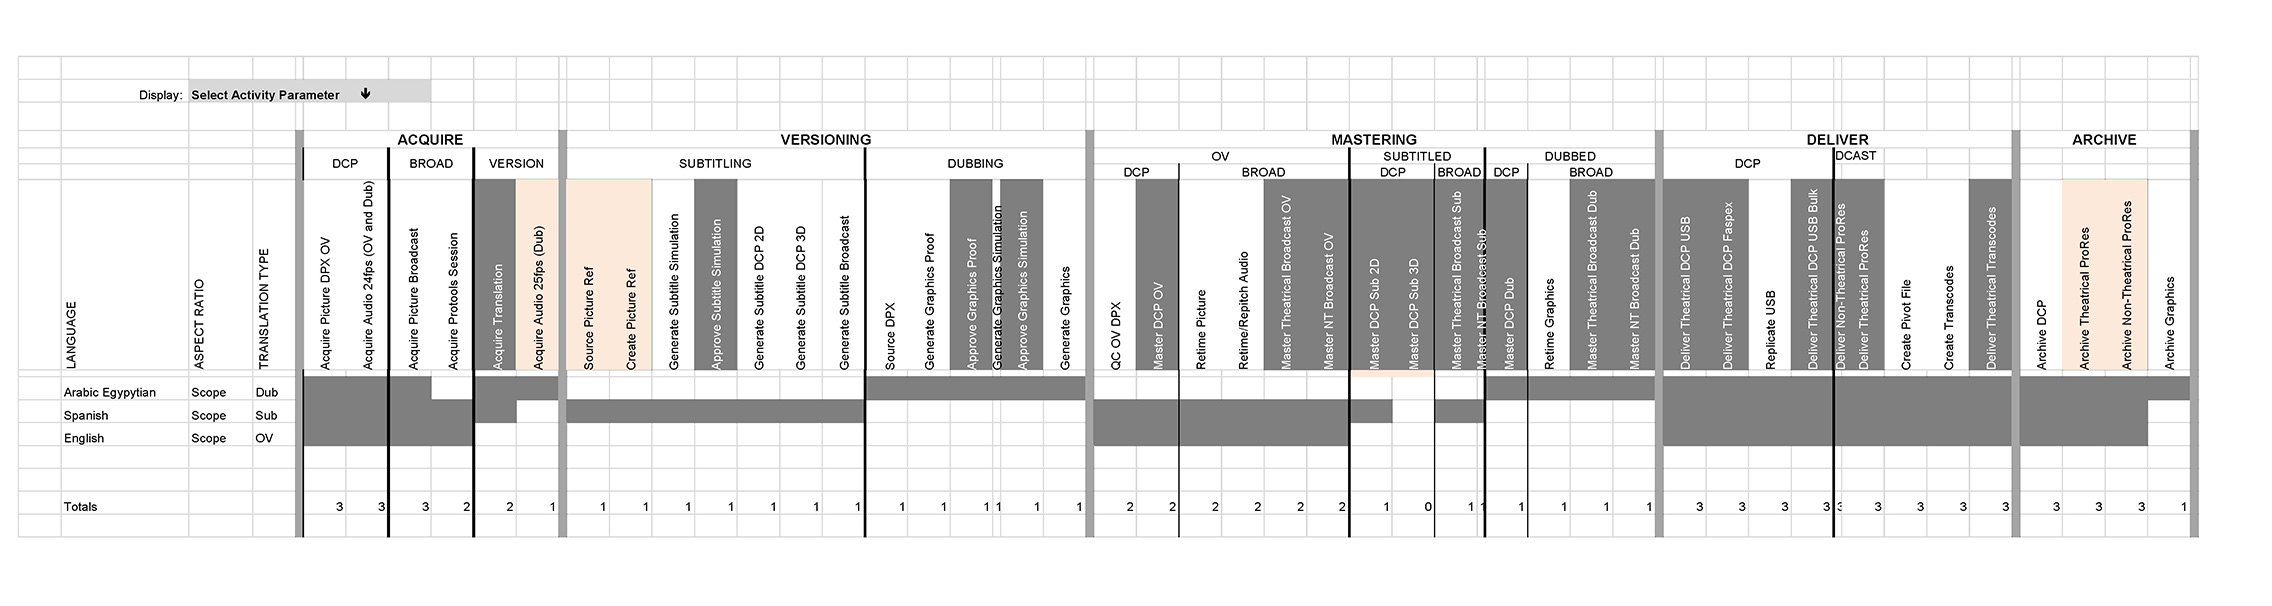
Stacking for At-a-Glance Visibility
By pattern matching, creative re-organization and grouoing, I was able to create a nearly one-to-one relationship between the production of the Broadcast and the DCP. By stacking the two workflows, at-a-glance, each could be monitored simultaneously.
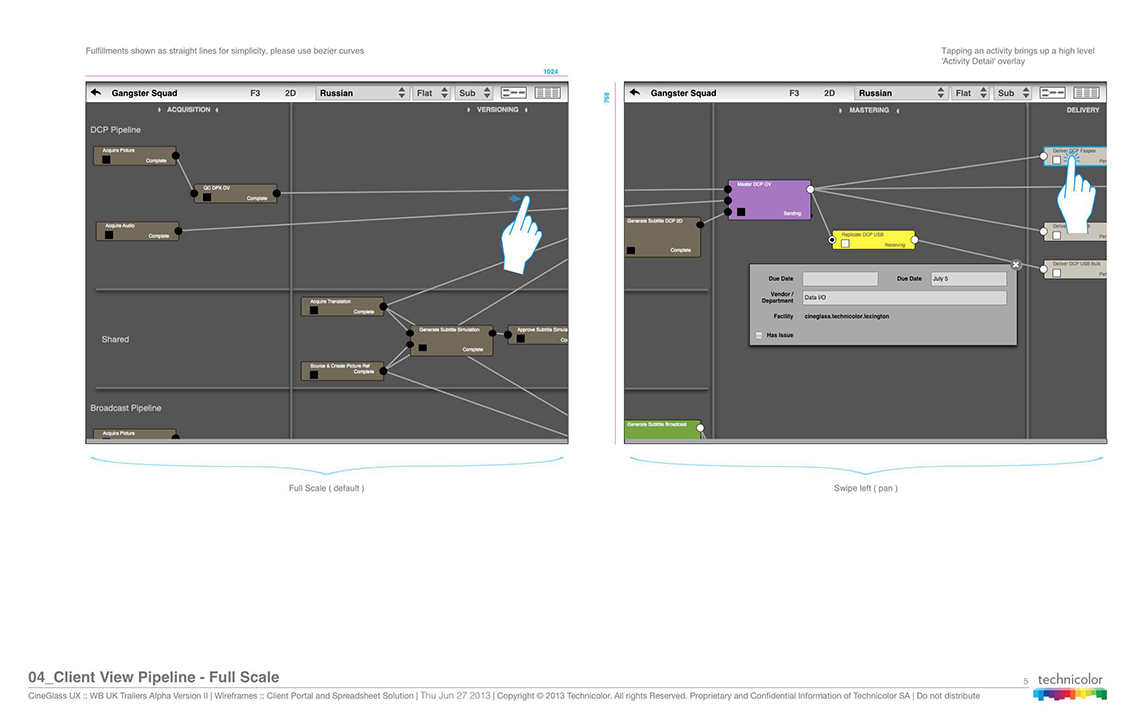
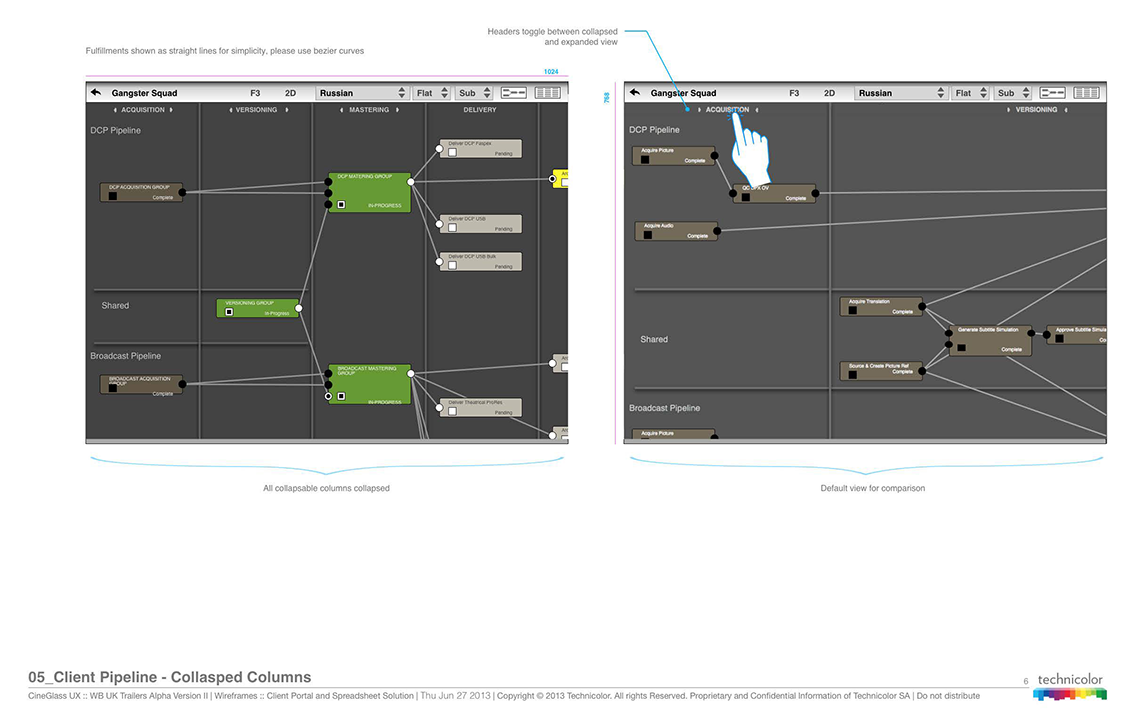

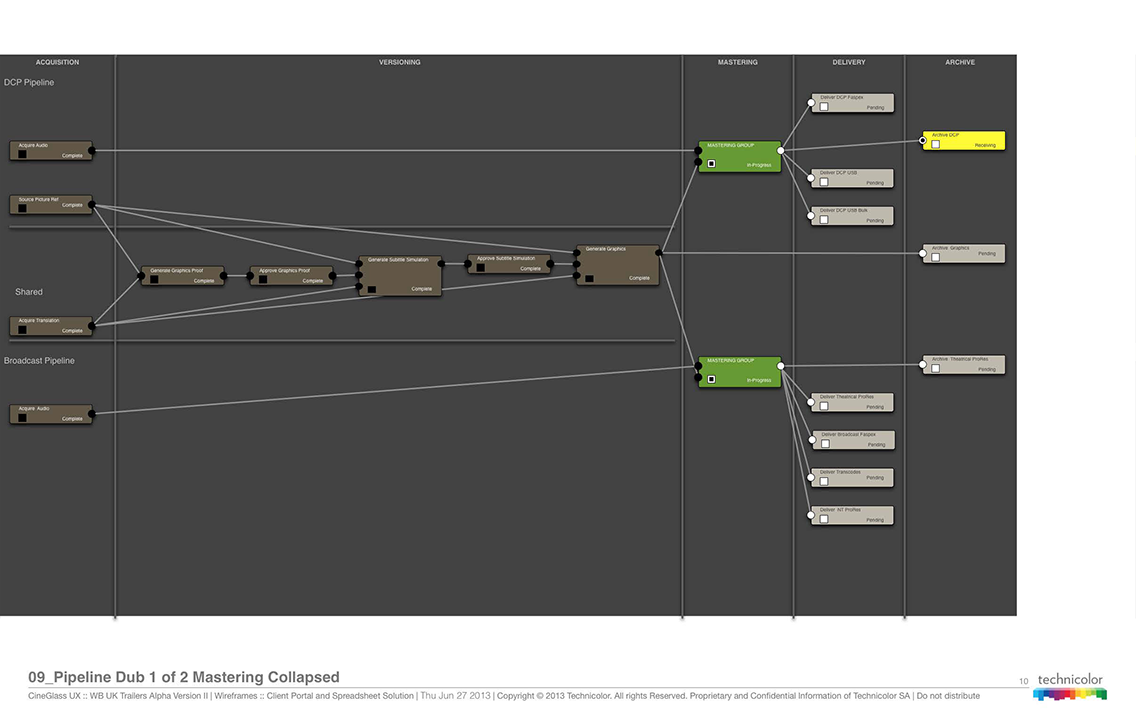
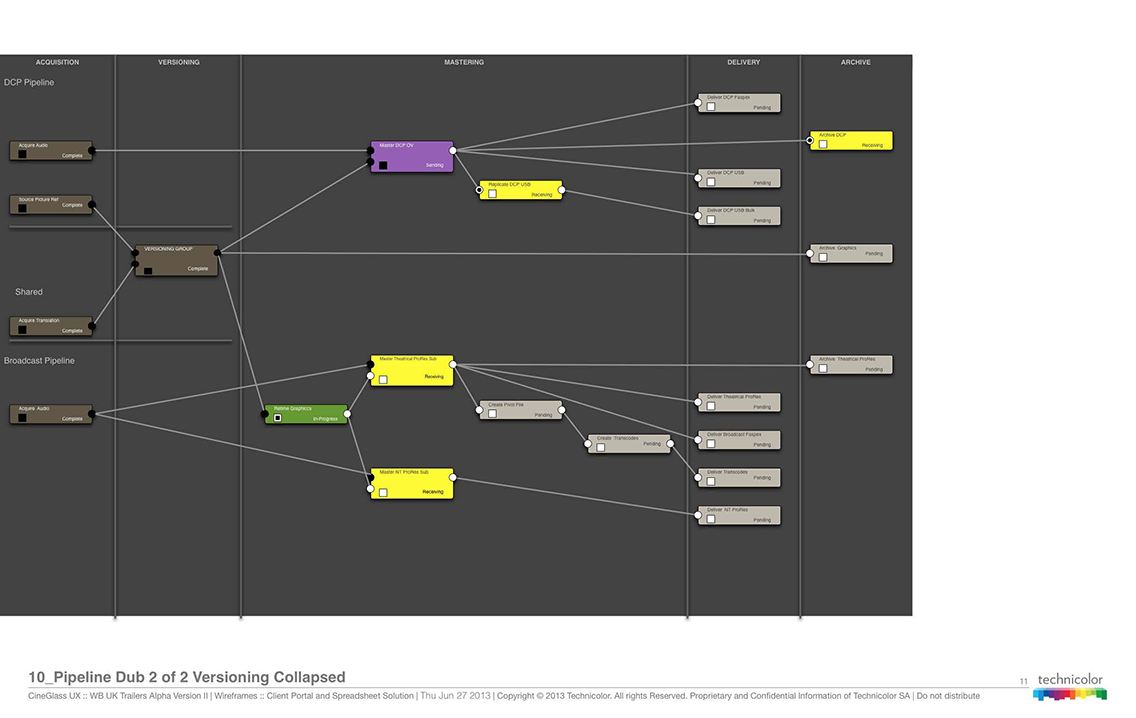
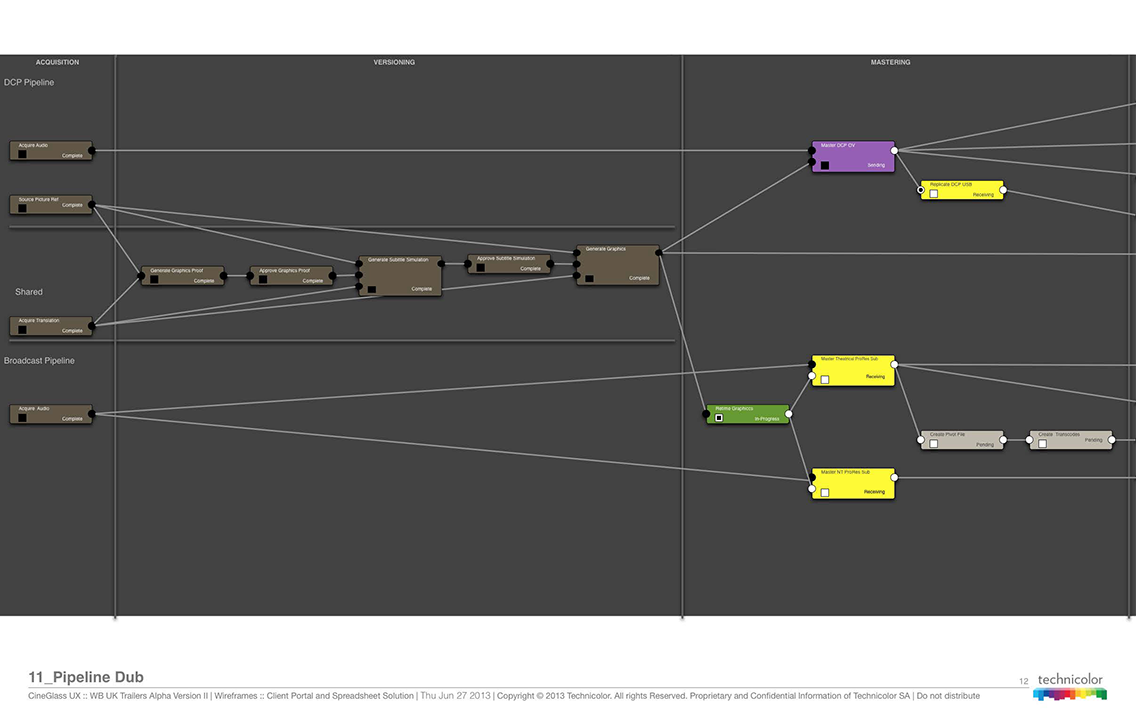
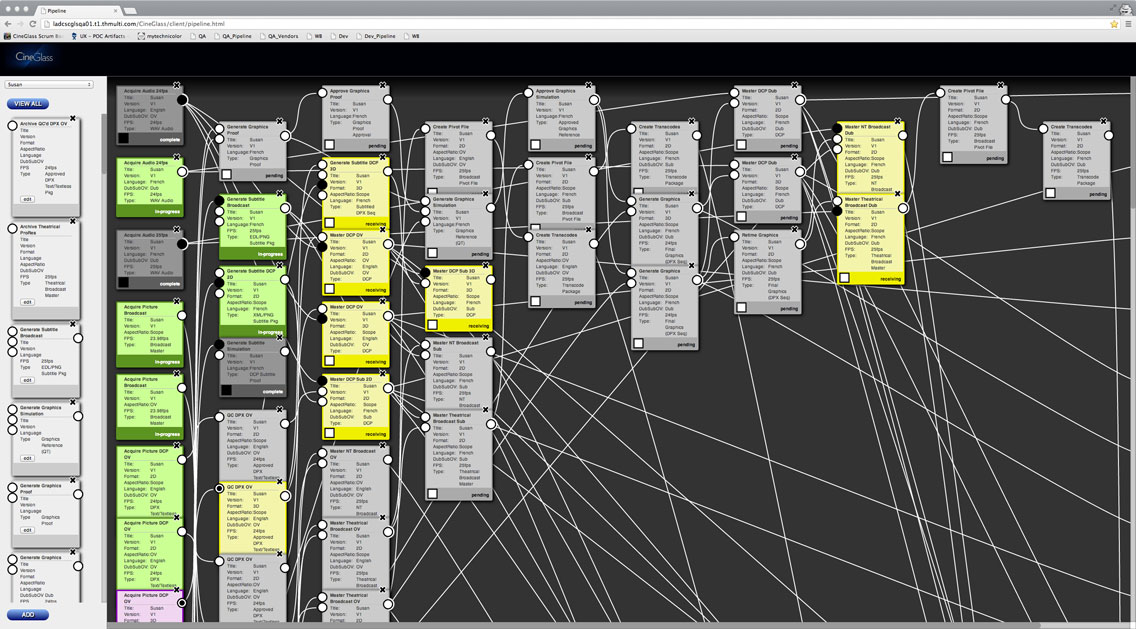
Structured Pipeline
The new groupings also made the pipeline view easier to manage. It also became clear at-a-glance what assets where shared and where the ciritcal dependencies existed.
Retrospective
The team and I persevered through the film service division shut down. We persevered after proving the concept--expecting that our team would be more than doubled, it was cut in half. Despite the lack of executive-level support, we persevered and designed a great solution that met the needs and the expectations of the users, and it solved several problems for technicolor.
The fate of a product, project, or creative decision may not be in the control of the designer. My as a design lead is to diligently know and empathize with the user, to faithfully integrate the business objectives, and to provide insightful, informed solutions. I use responsive communication skills to persuade teams in design thinking. I back up my design choices with sound conclusions.
Through this project I learned that I am an empathic listener that can effectively distill complex data, as well as, an intuitive and resourceful designer. Regardless of the outcome of any project, I know when I have led a team to create a solid design. And this time I know that I elegantly solved a problem that appeared to be unsolvable.